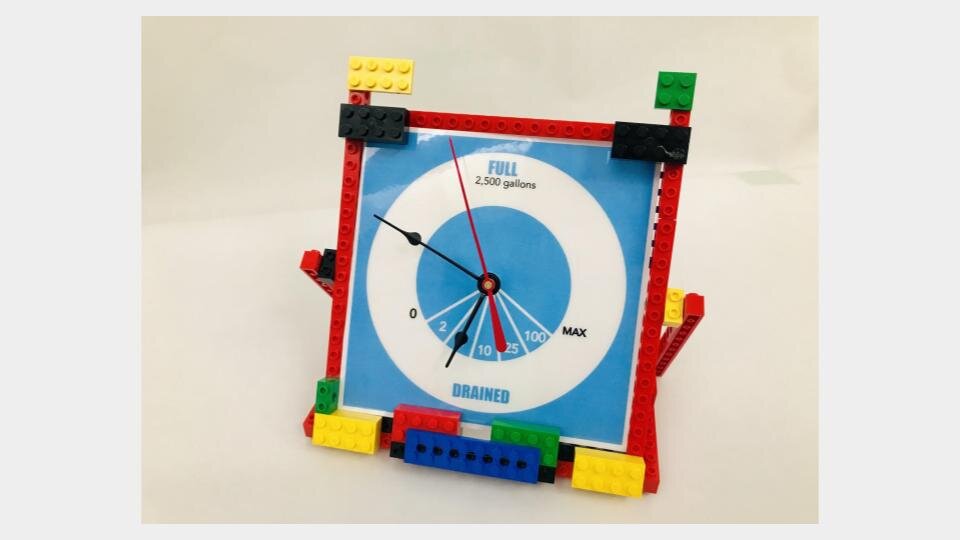
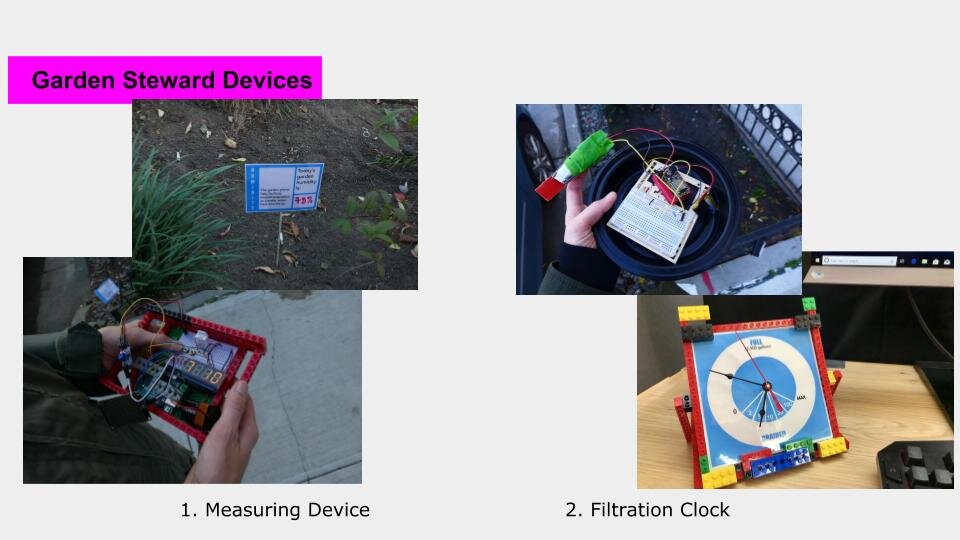
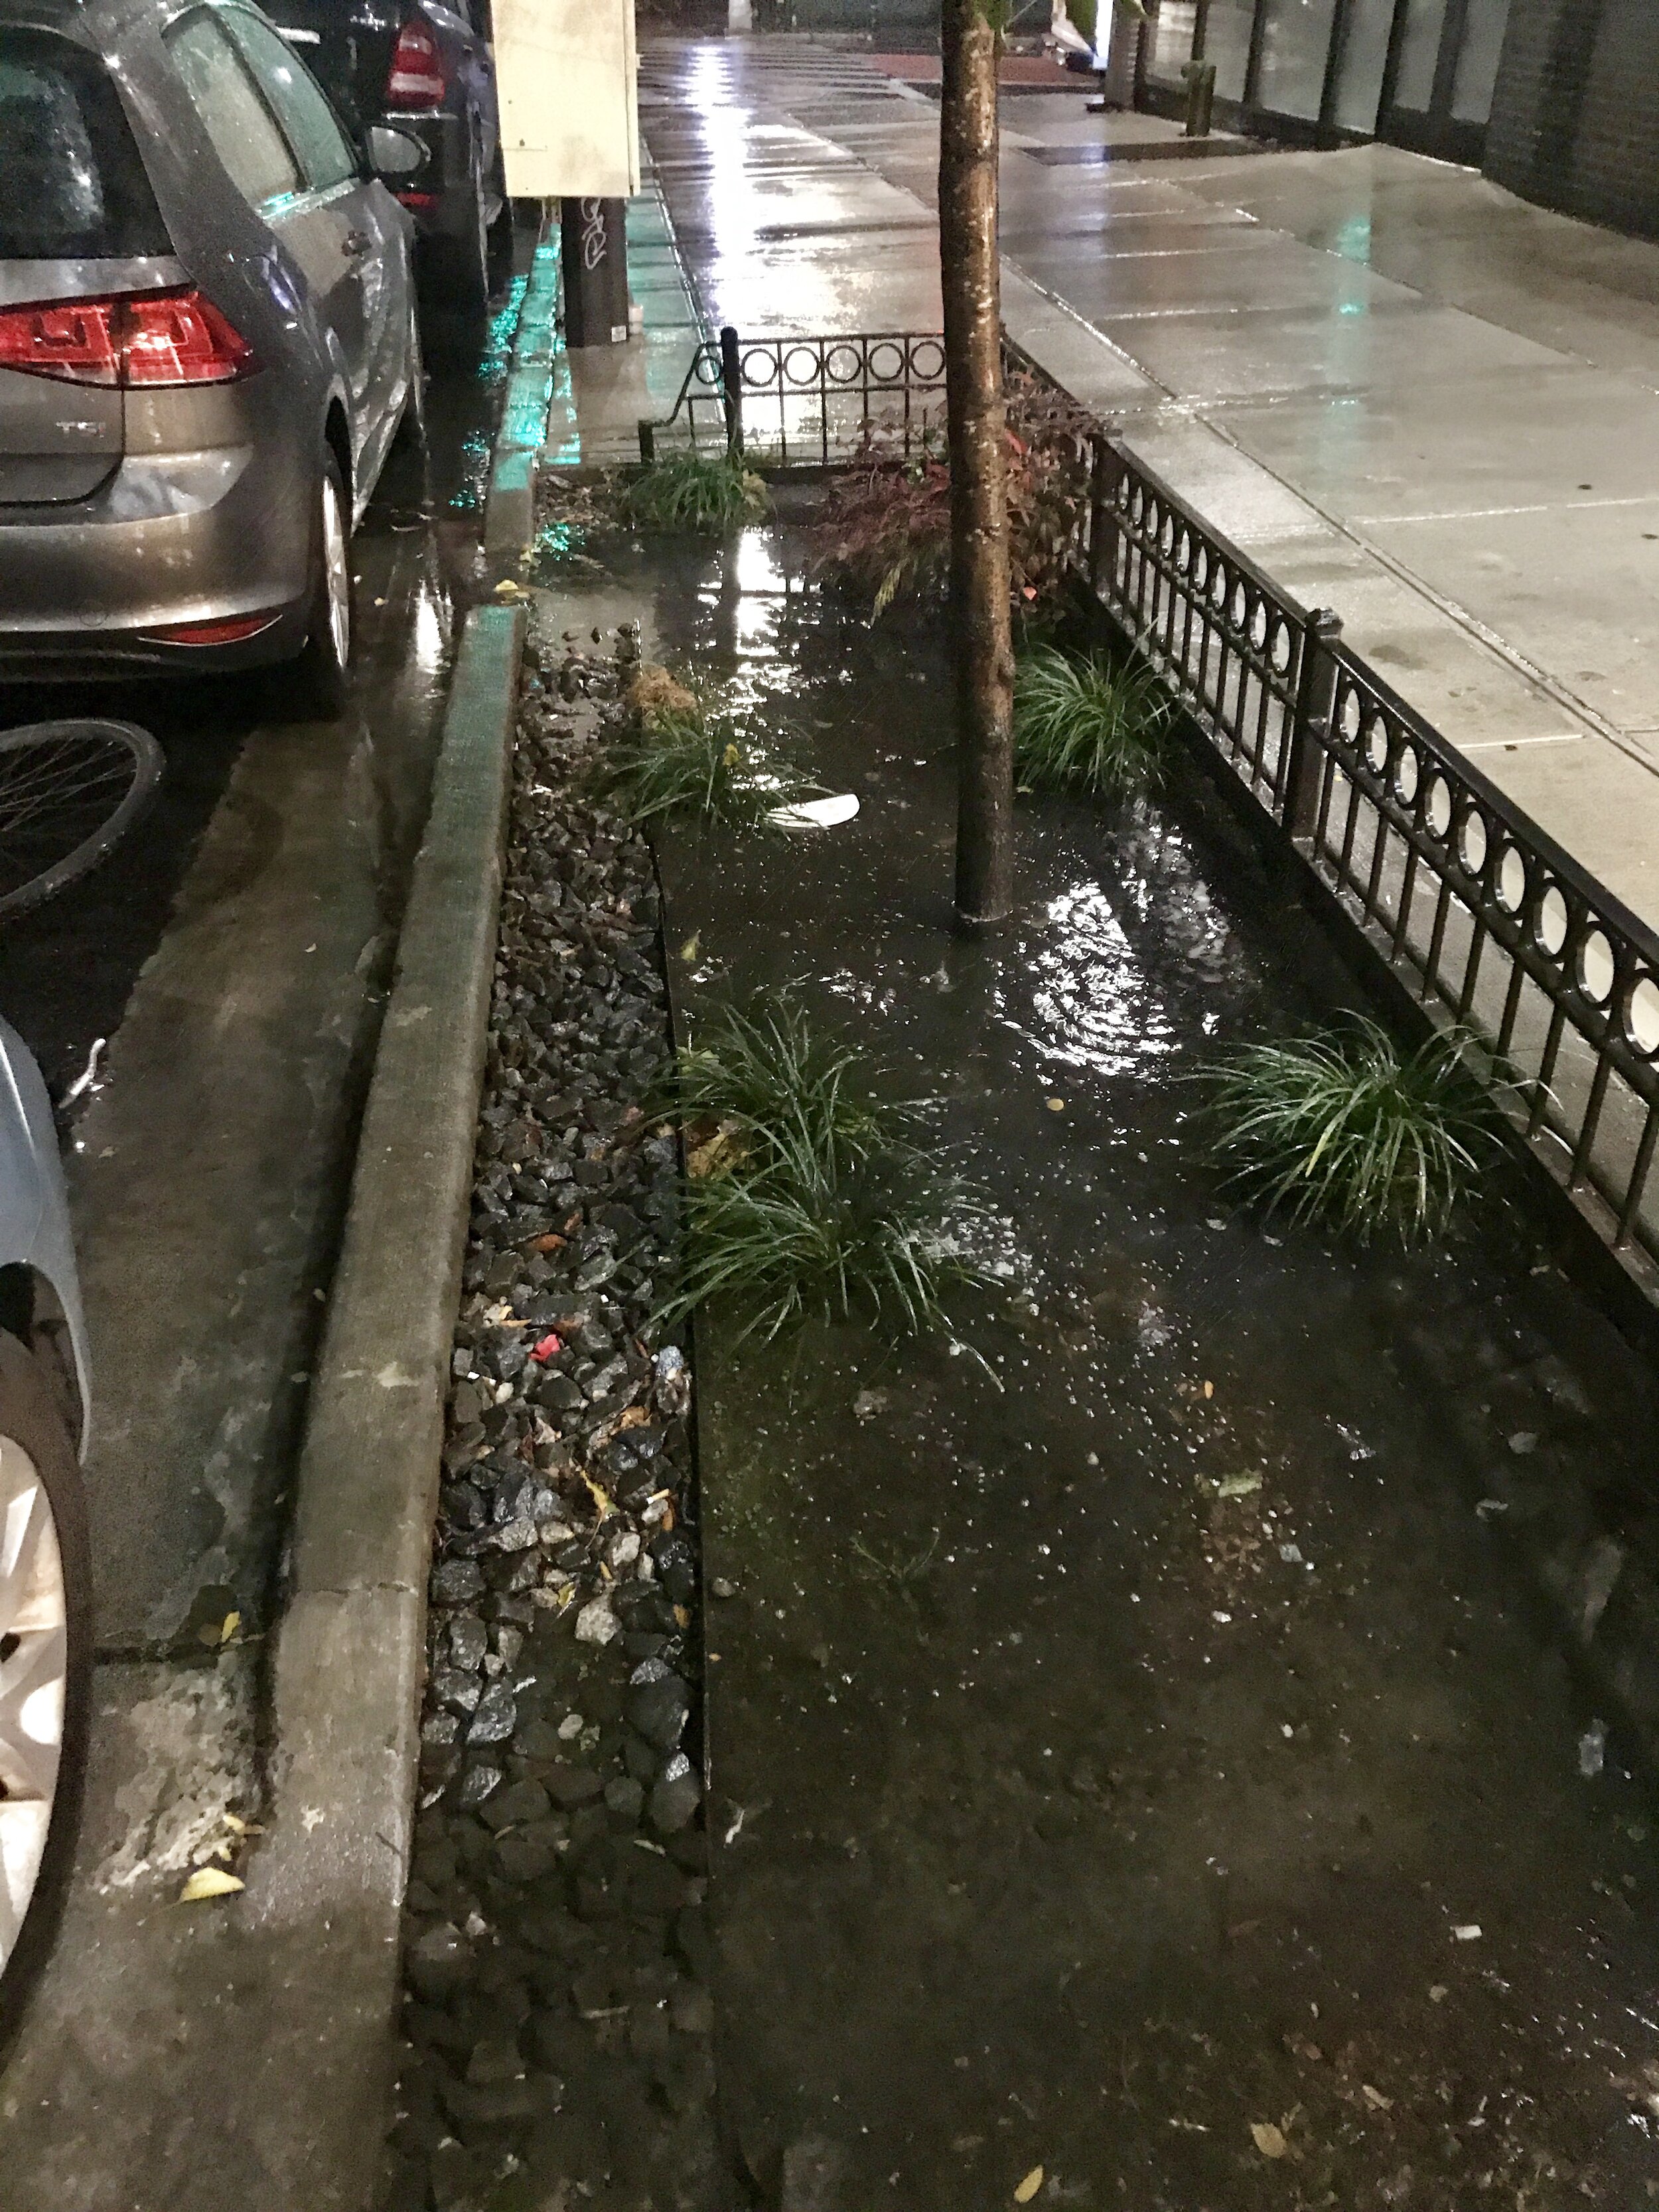
In response to the prompt to make a time piece, I made an IoT device for my rain garden to measure its cycles and flows of water and a corresponding clock face to display this time cycle.
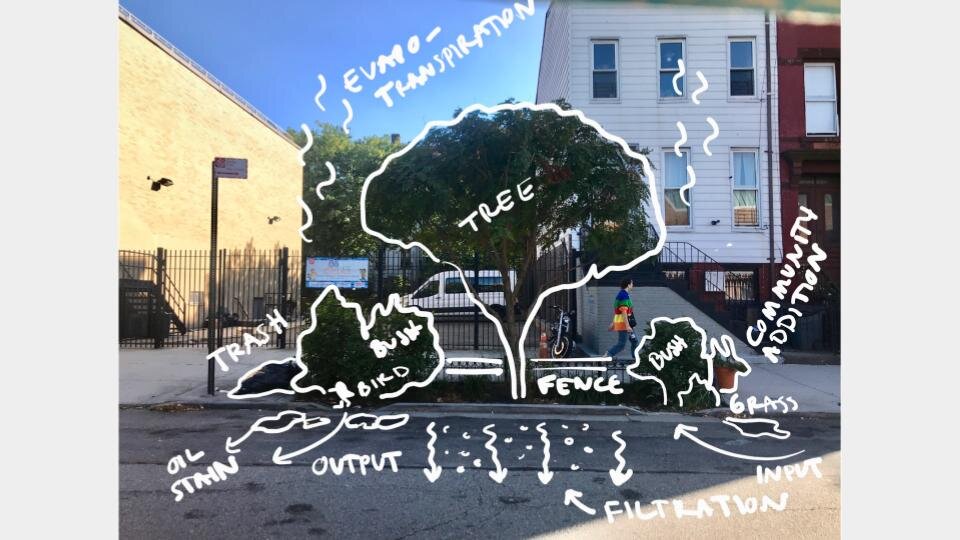
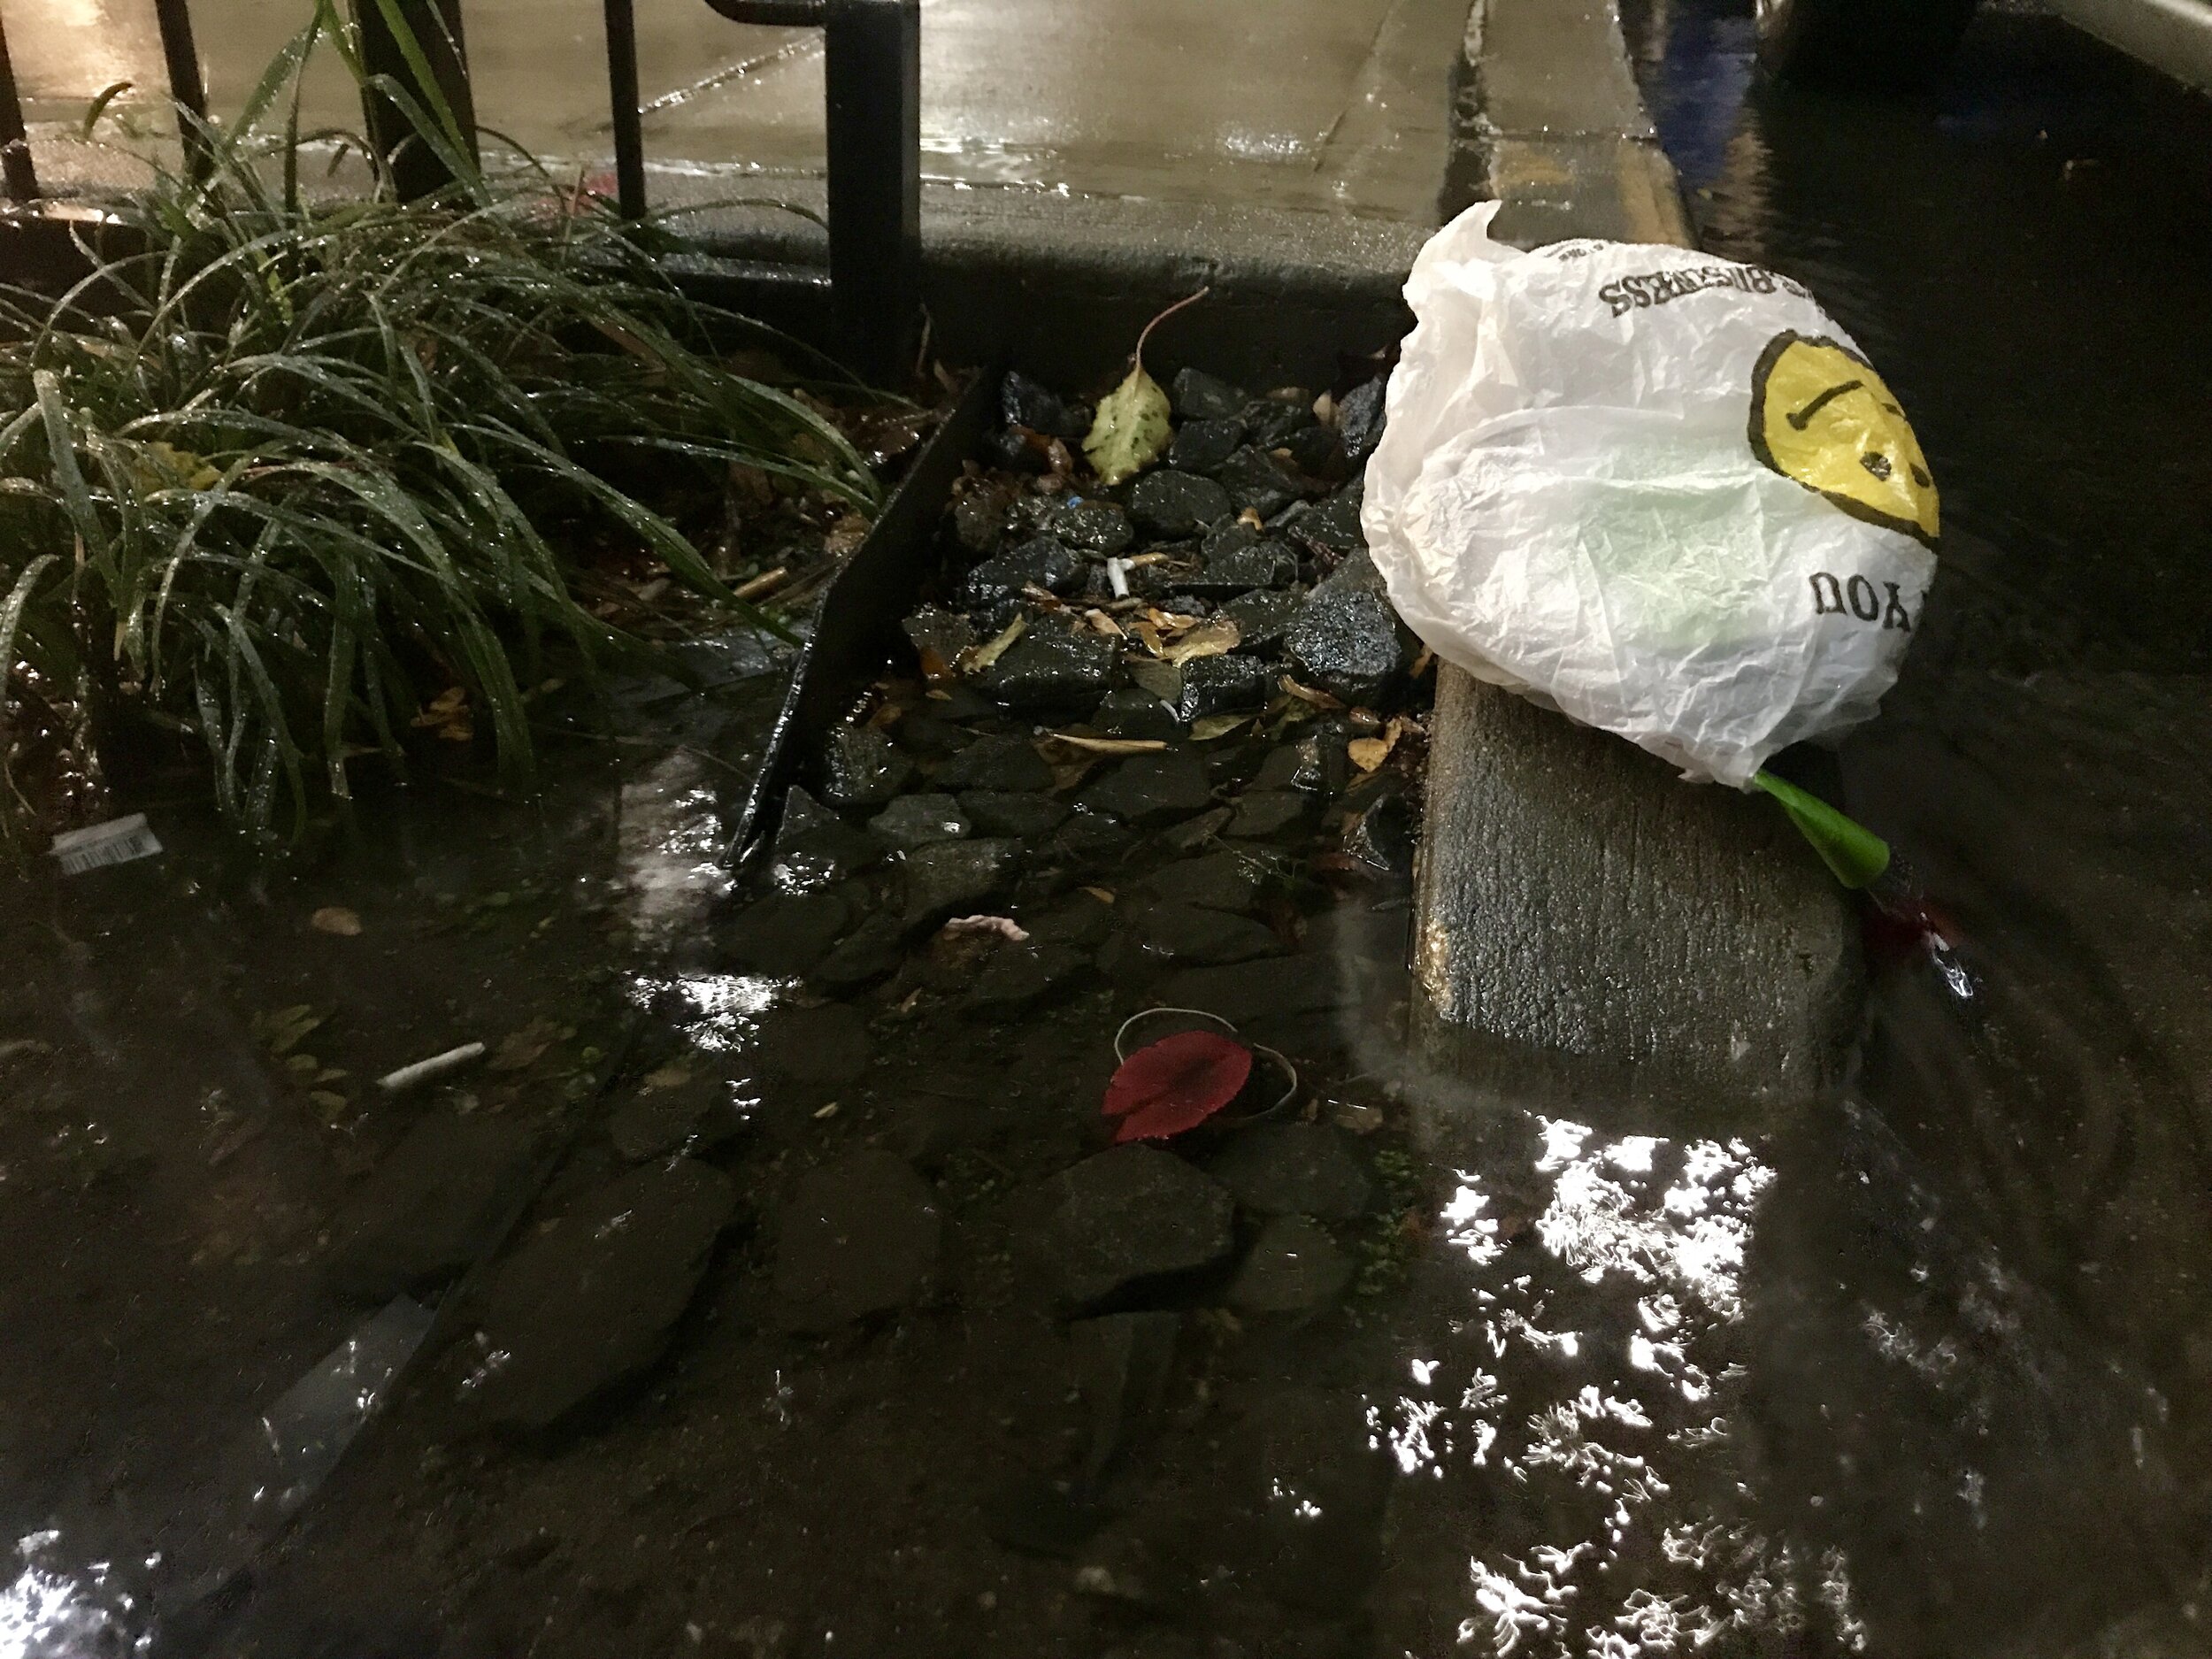
As I have been studying the rain gardens this semester, I have been thinking about the inputs and outputs to the rain gardens. Water the most significant one and also what they are designed around. It’s main function. I was curious to see if I could measure this cycle and visualize it.
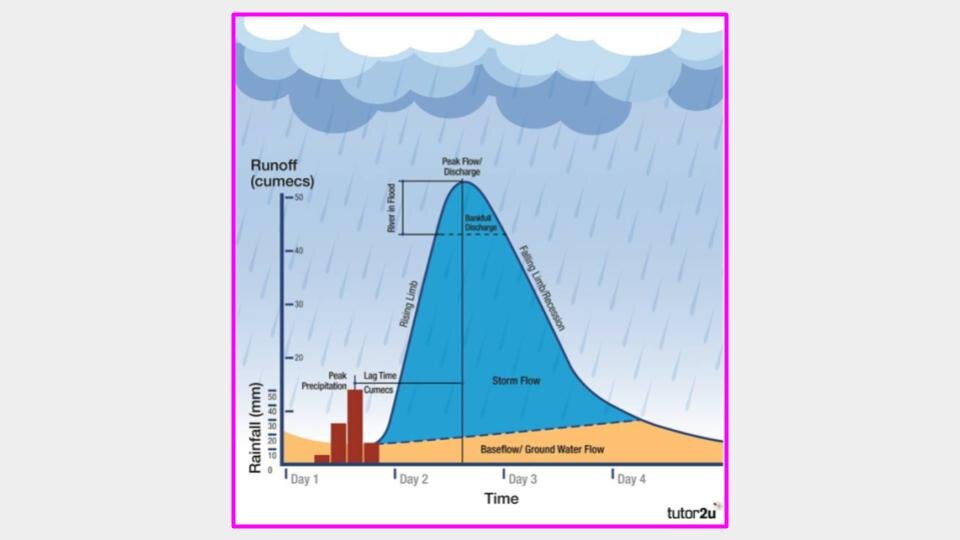
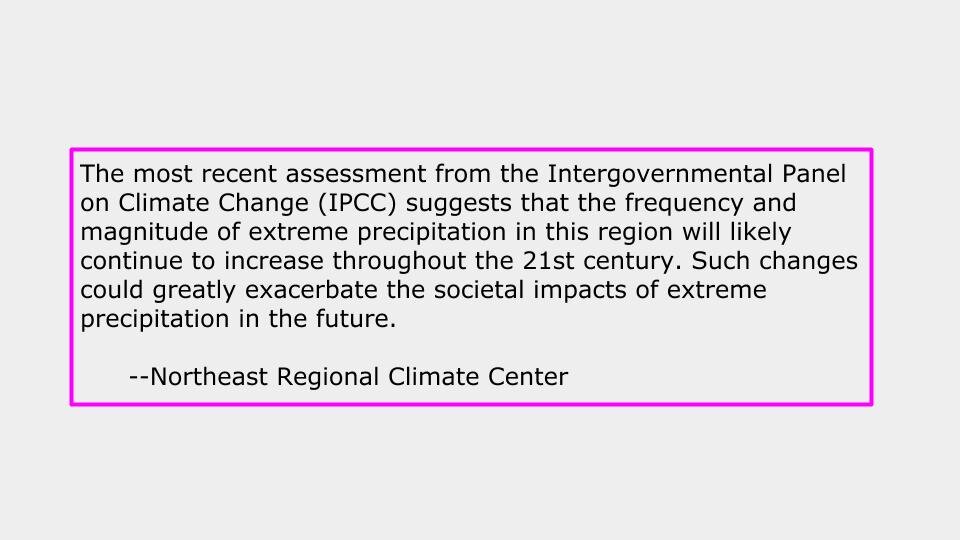
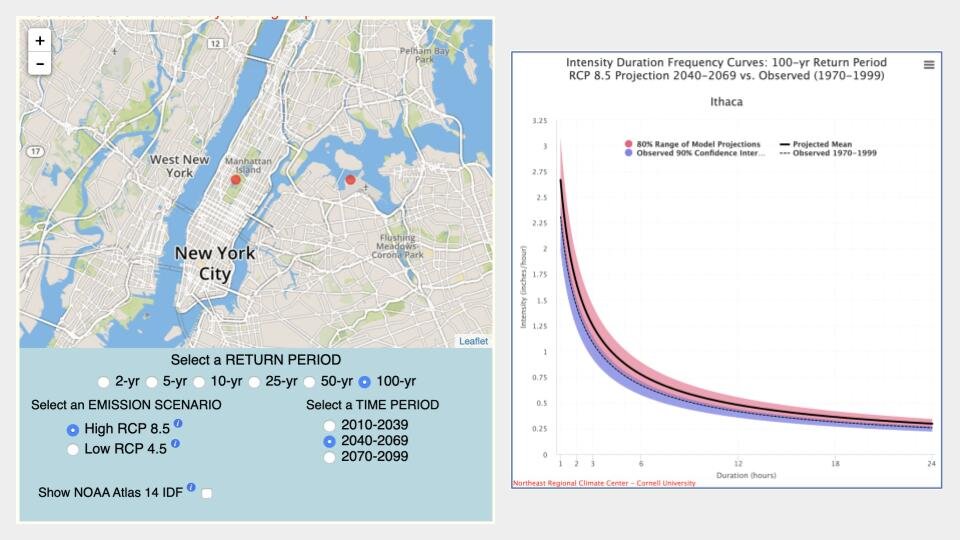
My design and approach is also based on research on storm hydrographs and the return period for storms. The Northeast Regional Climate Center has found that these storms are getting stronger and more frequent in the New York City region. I wondered if I could make a device that captured these rhythms.
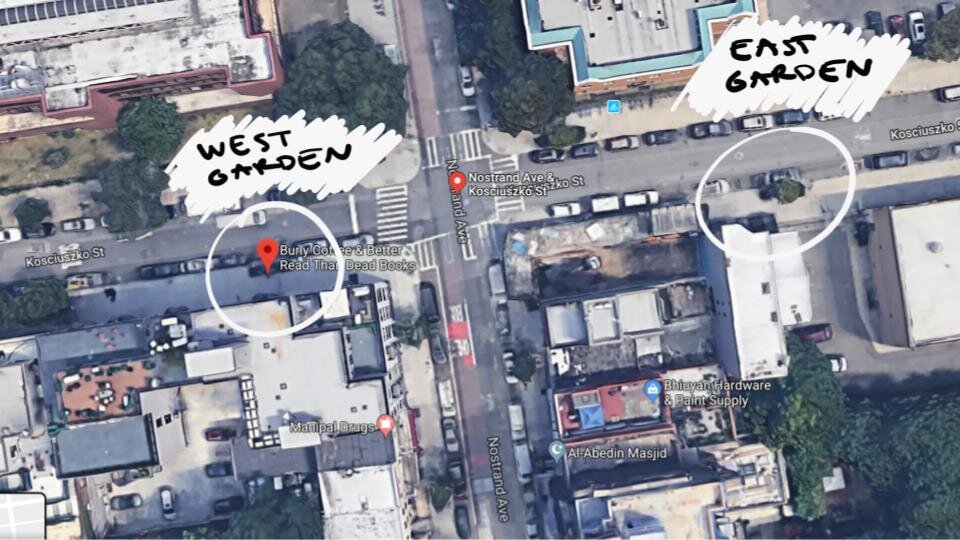
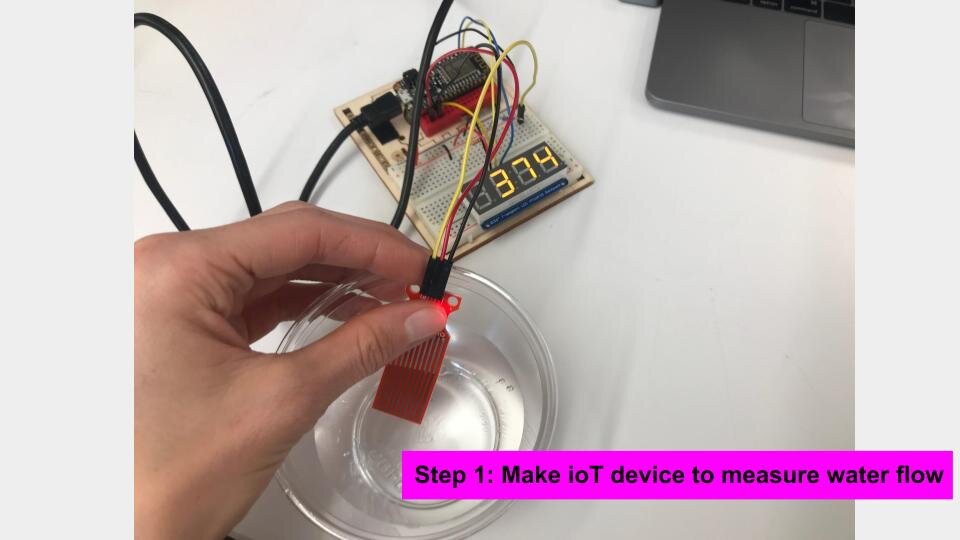
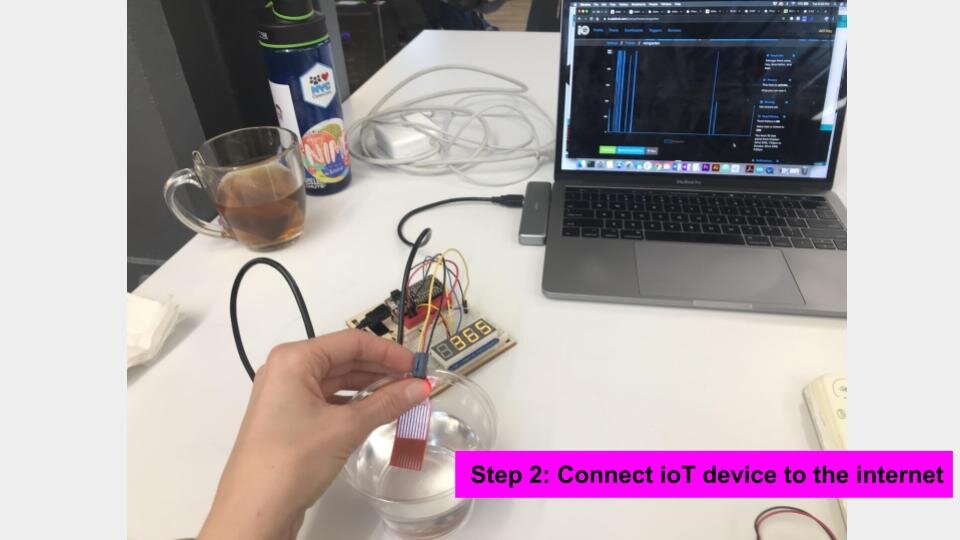
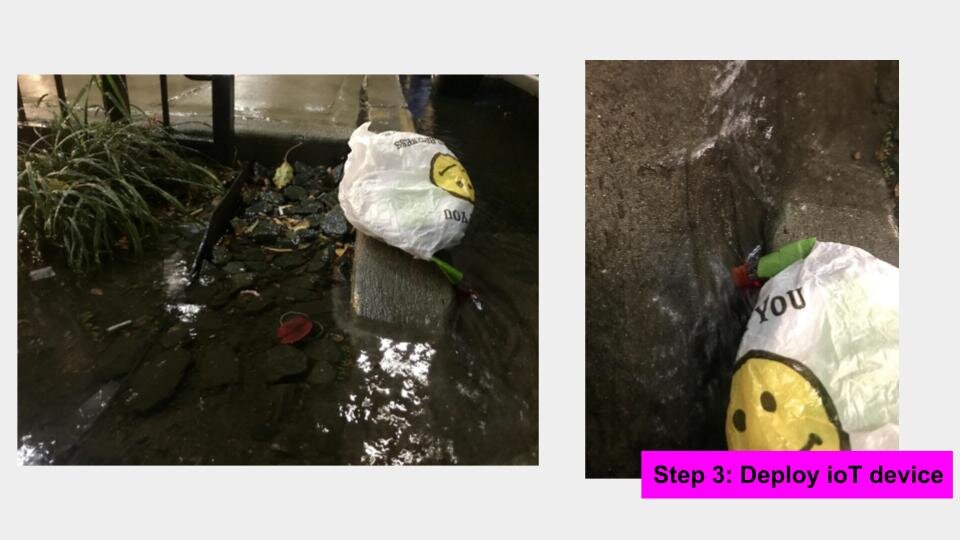
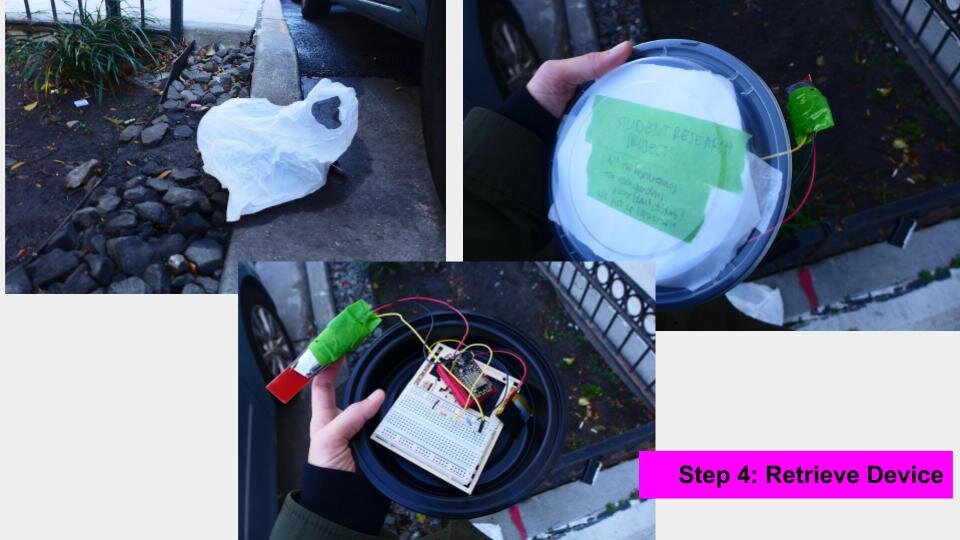
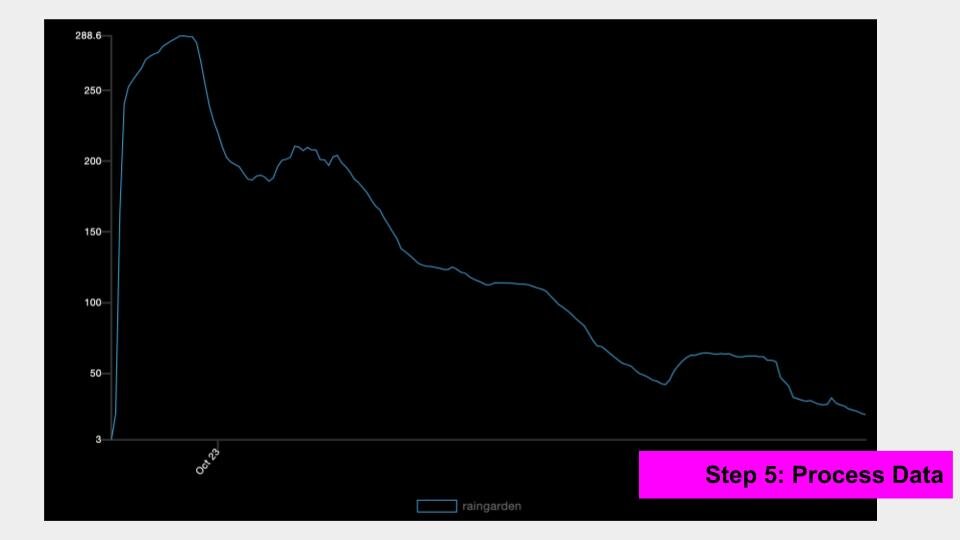
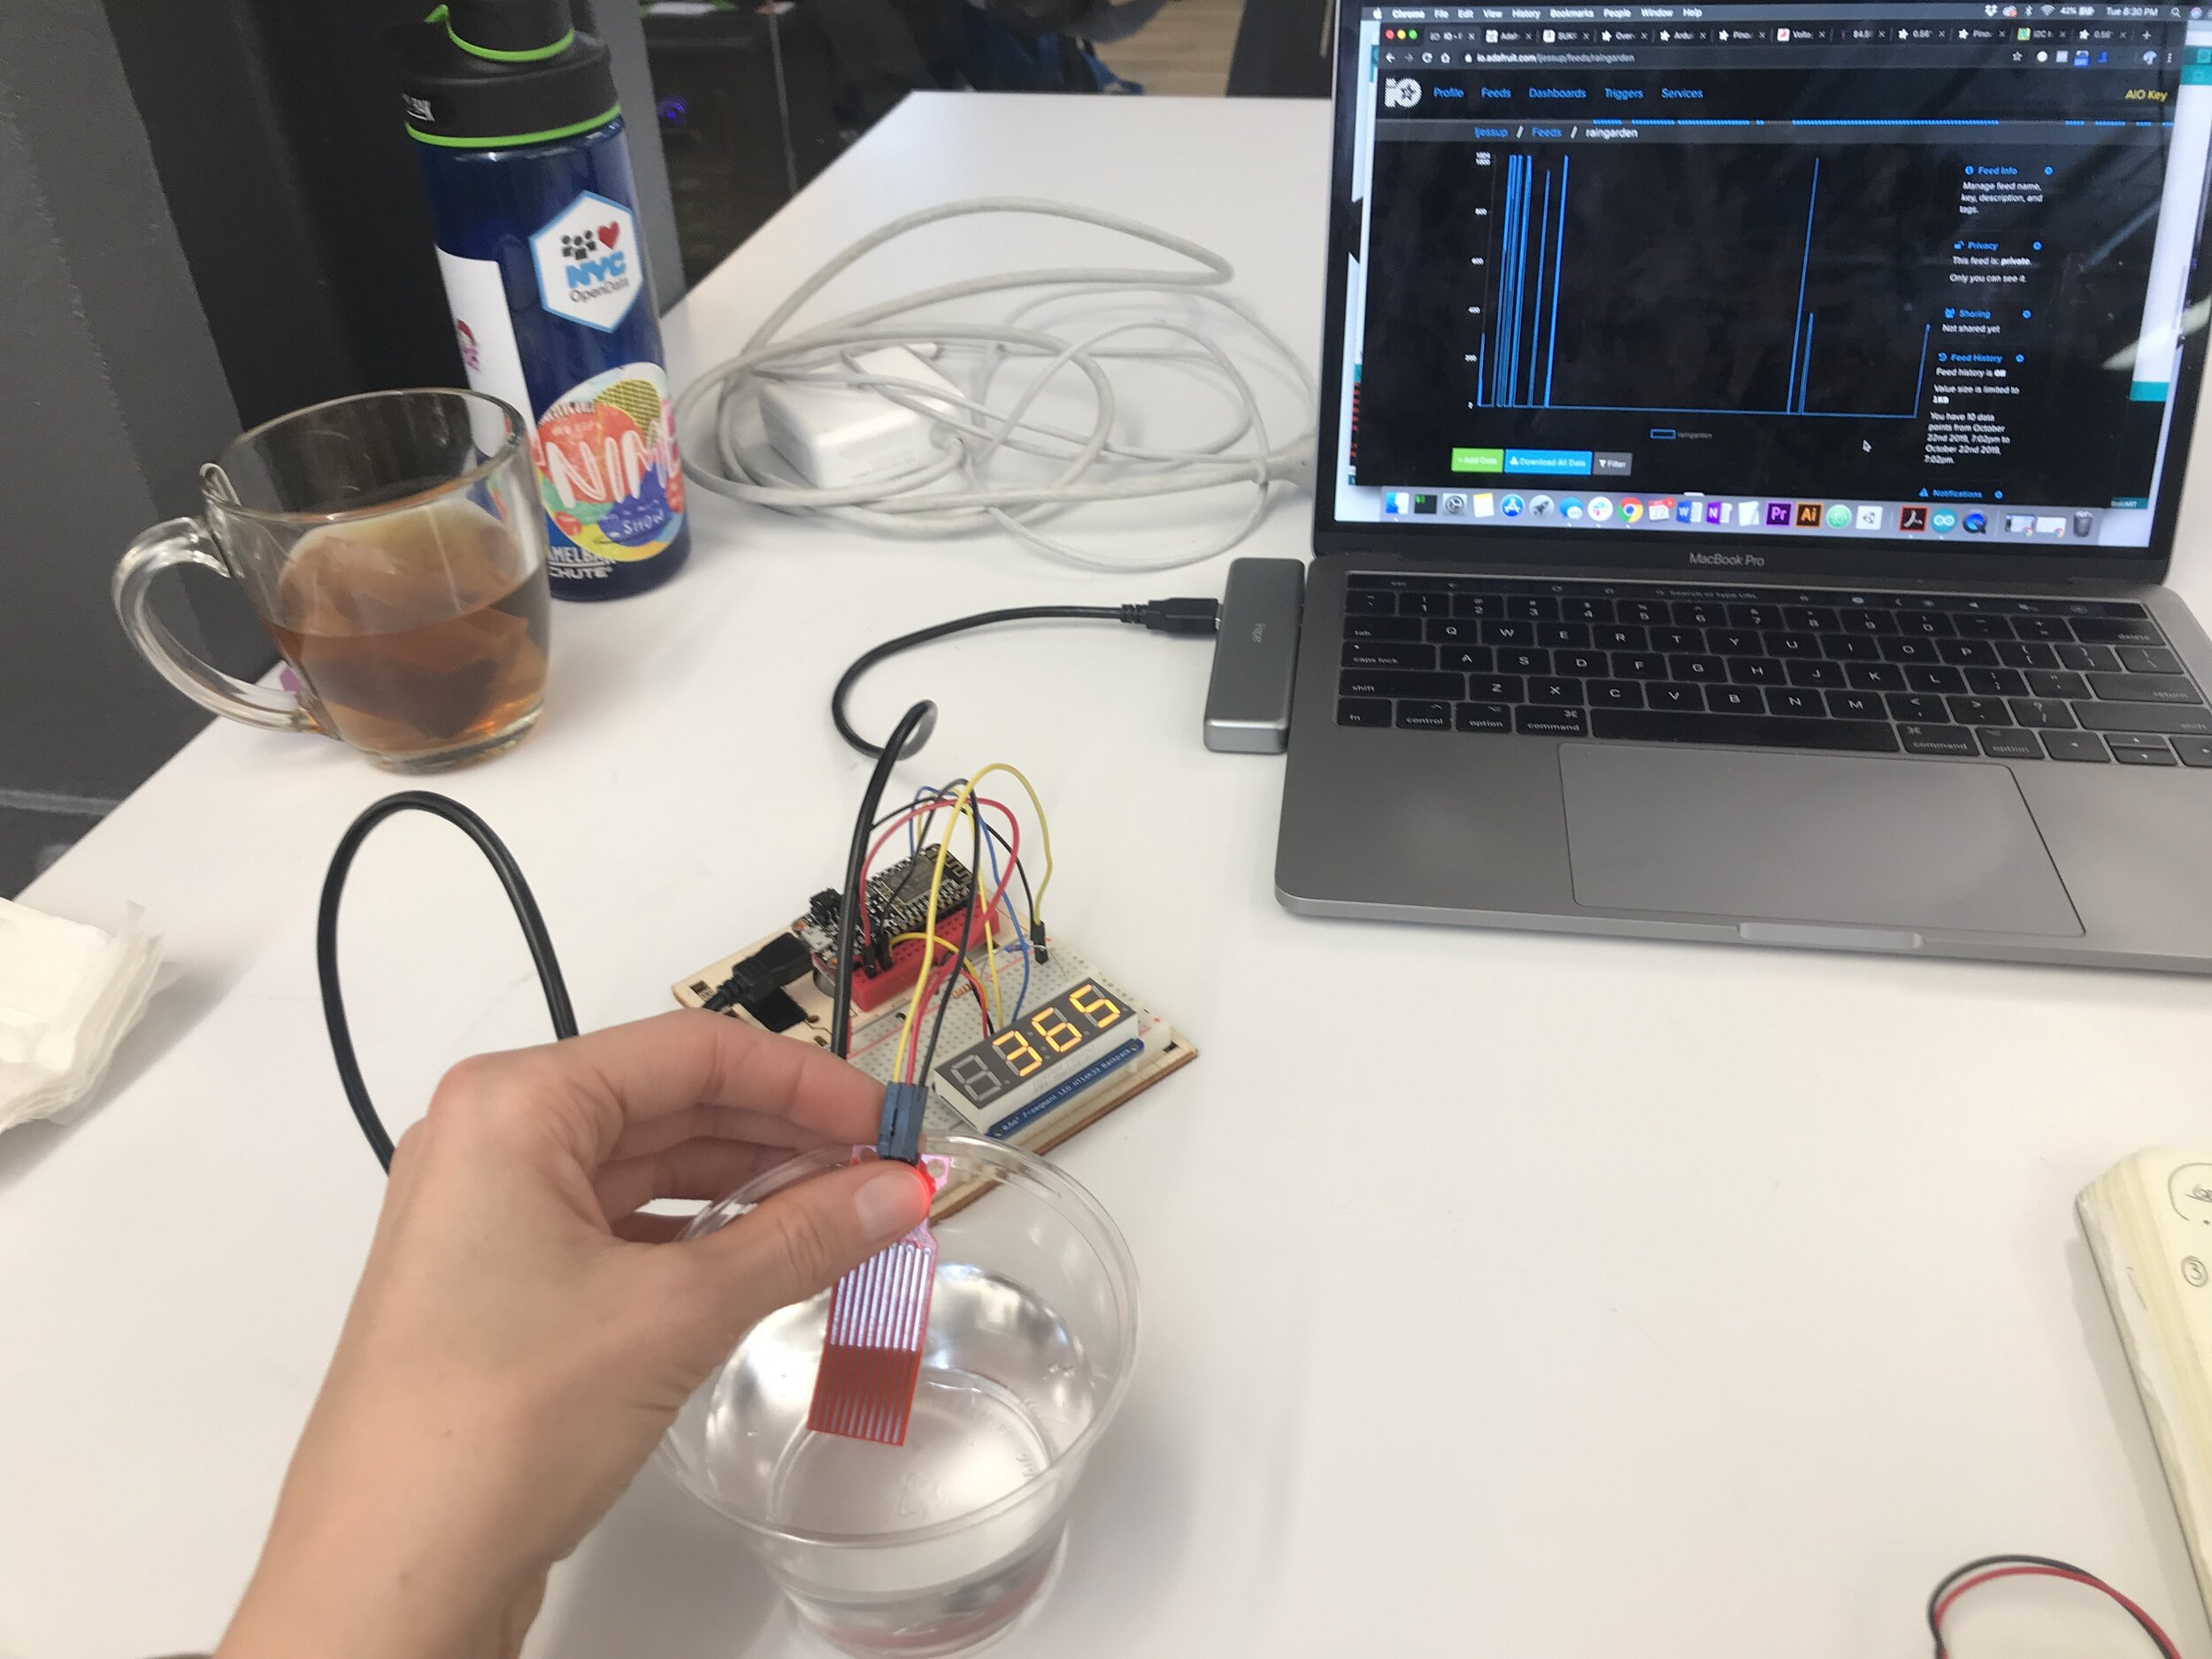
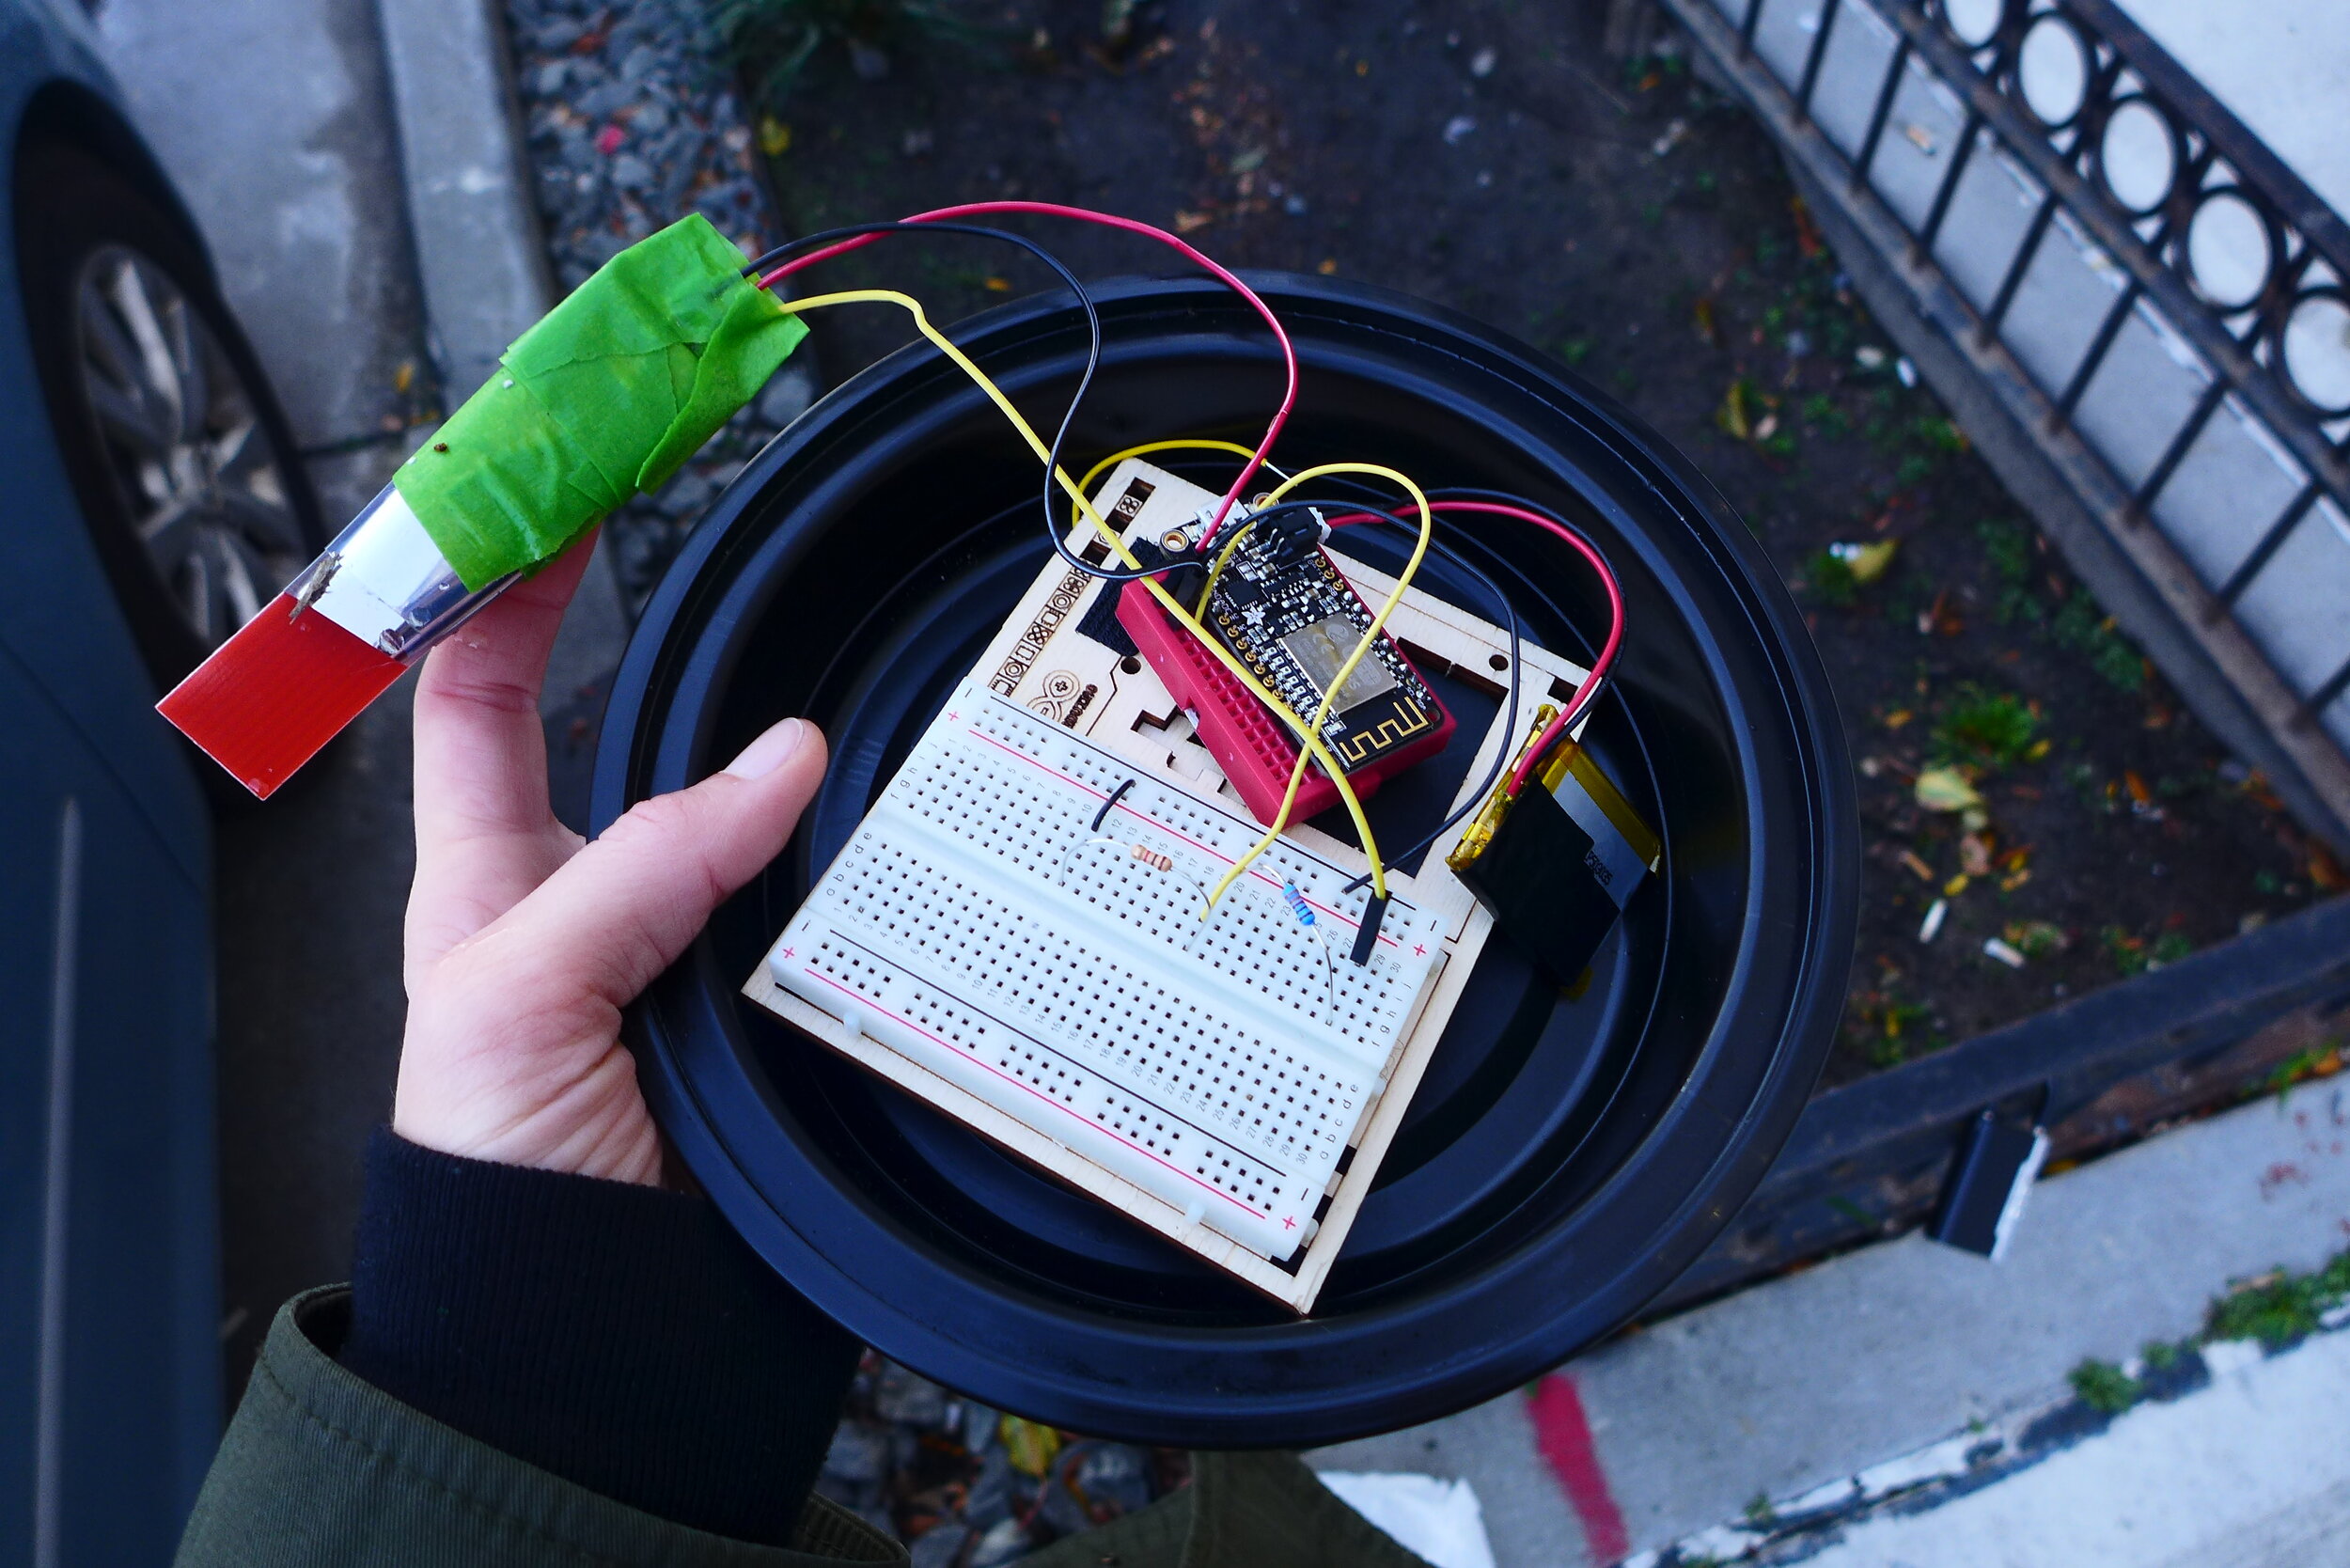
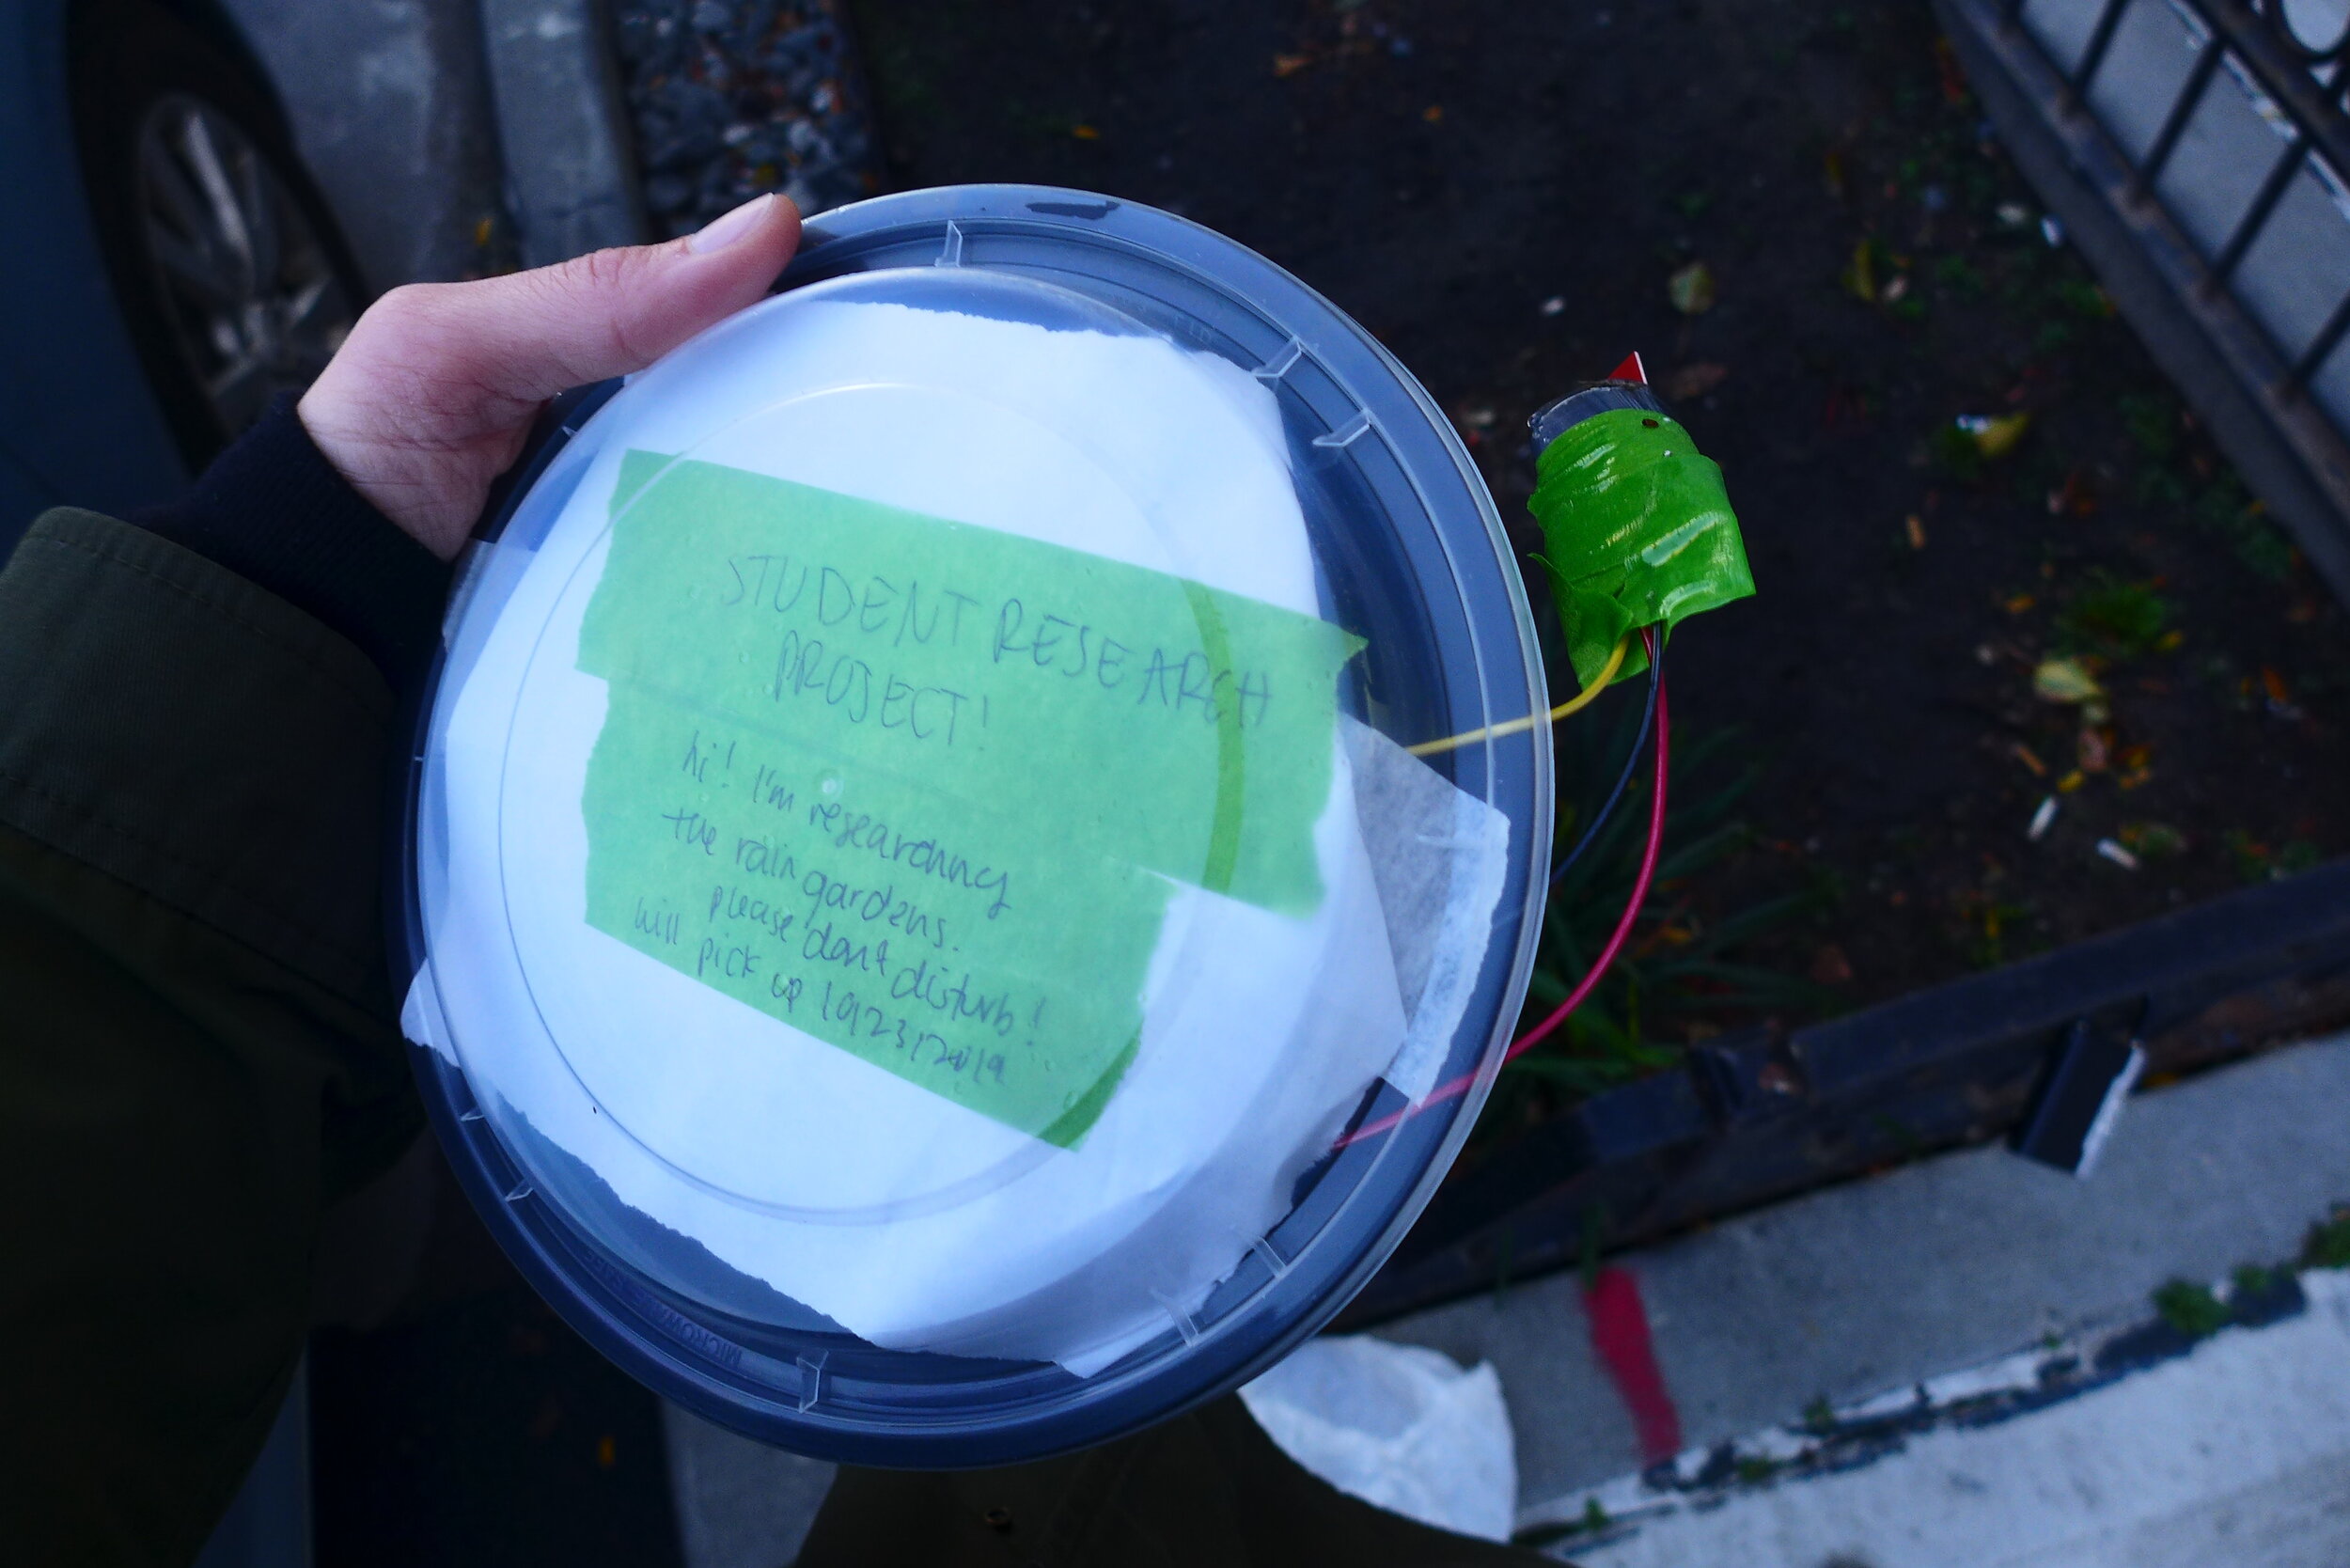
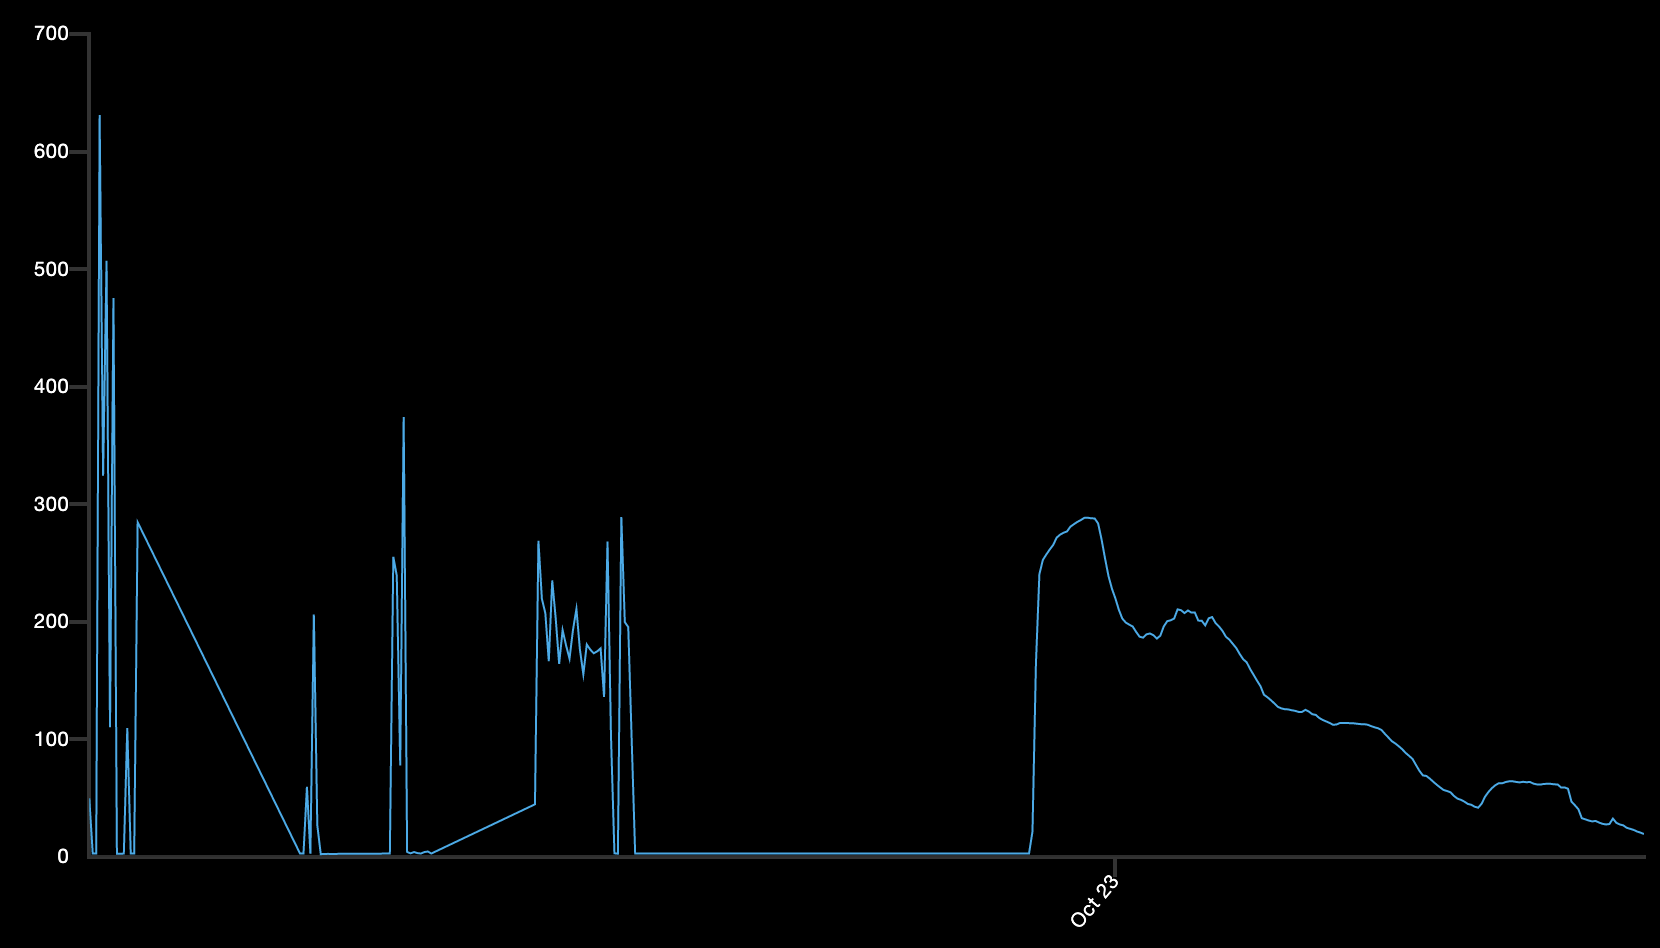
For the measurement, I decided to use a water depth sensor that I had in order to measure the flow of water into the rain garden. I used an Adafruit Feather Huzzah, which is a wifi enabled microcontroller and hooked it up to the water level sensor. This wasn’t quite as straightforward as I thought it would be because the analog pin on the Feather is 1V and the sensor is 3-5V, so I had to make a voltage divider. Once I got that working, I used the Adafruit IO API to send the data to a feed and quickly visualize it. I tested it on the ITP sandbox network, then changed the password and network name to the internet for the coffee shop and took it out into the field.
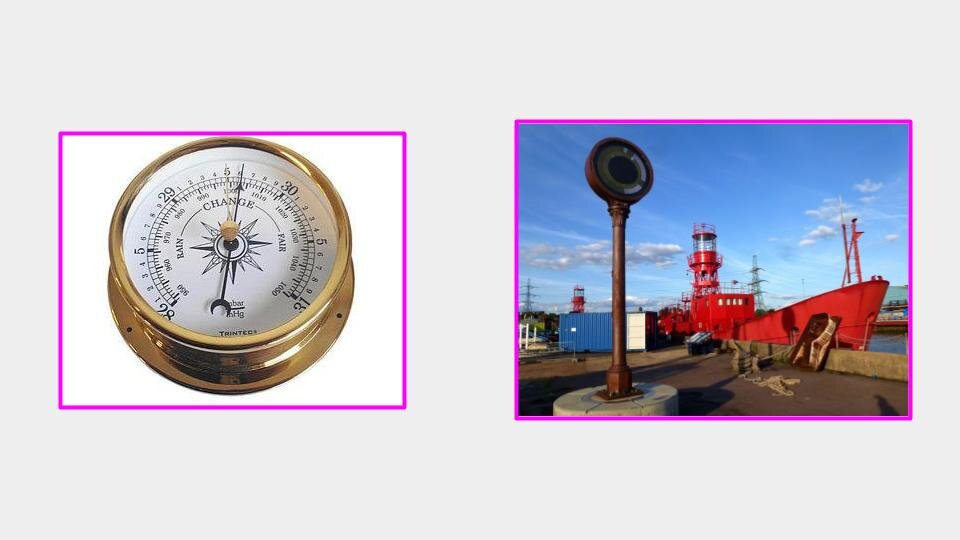
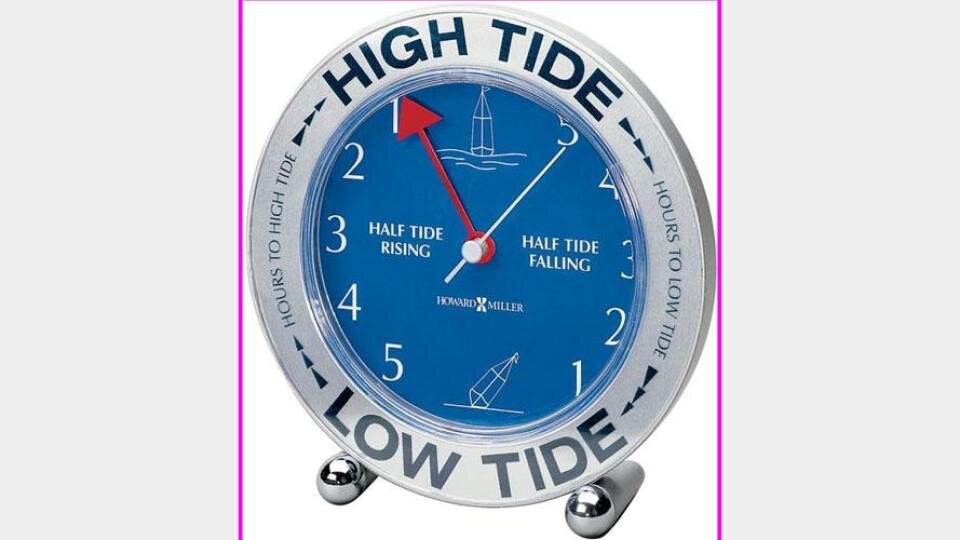
For the display and interpretation of this cycle, I decided to design a clock. During this research, saw a lot of similarities between the hydrograph and return period concepts and tide cycles, something I am familiar with from childhood. I wondered if I could use a similar method for picturing time for the rain garden.
Going into this project I wondered what these different elements would look like next to each other and how they relate. I feel I have a better understanding of this, but also working on this project through the format of the tide clock made me think of the question in more immediate terms rather than on a calendar time-series scale, which I had never thought of before.
I wanted to display the following together for each rain event:
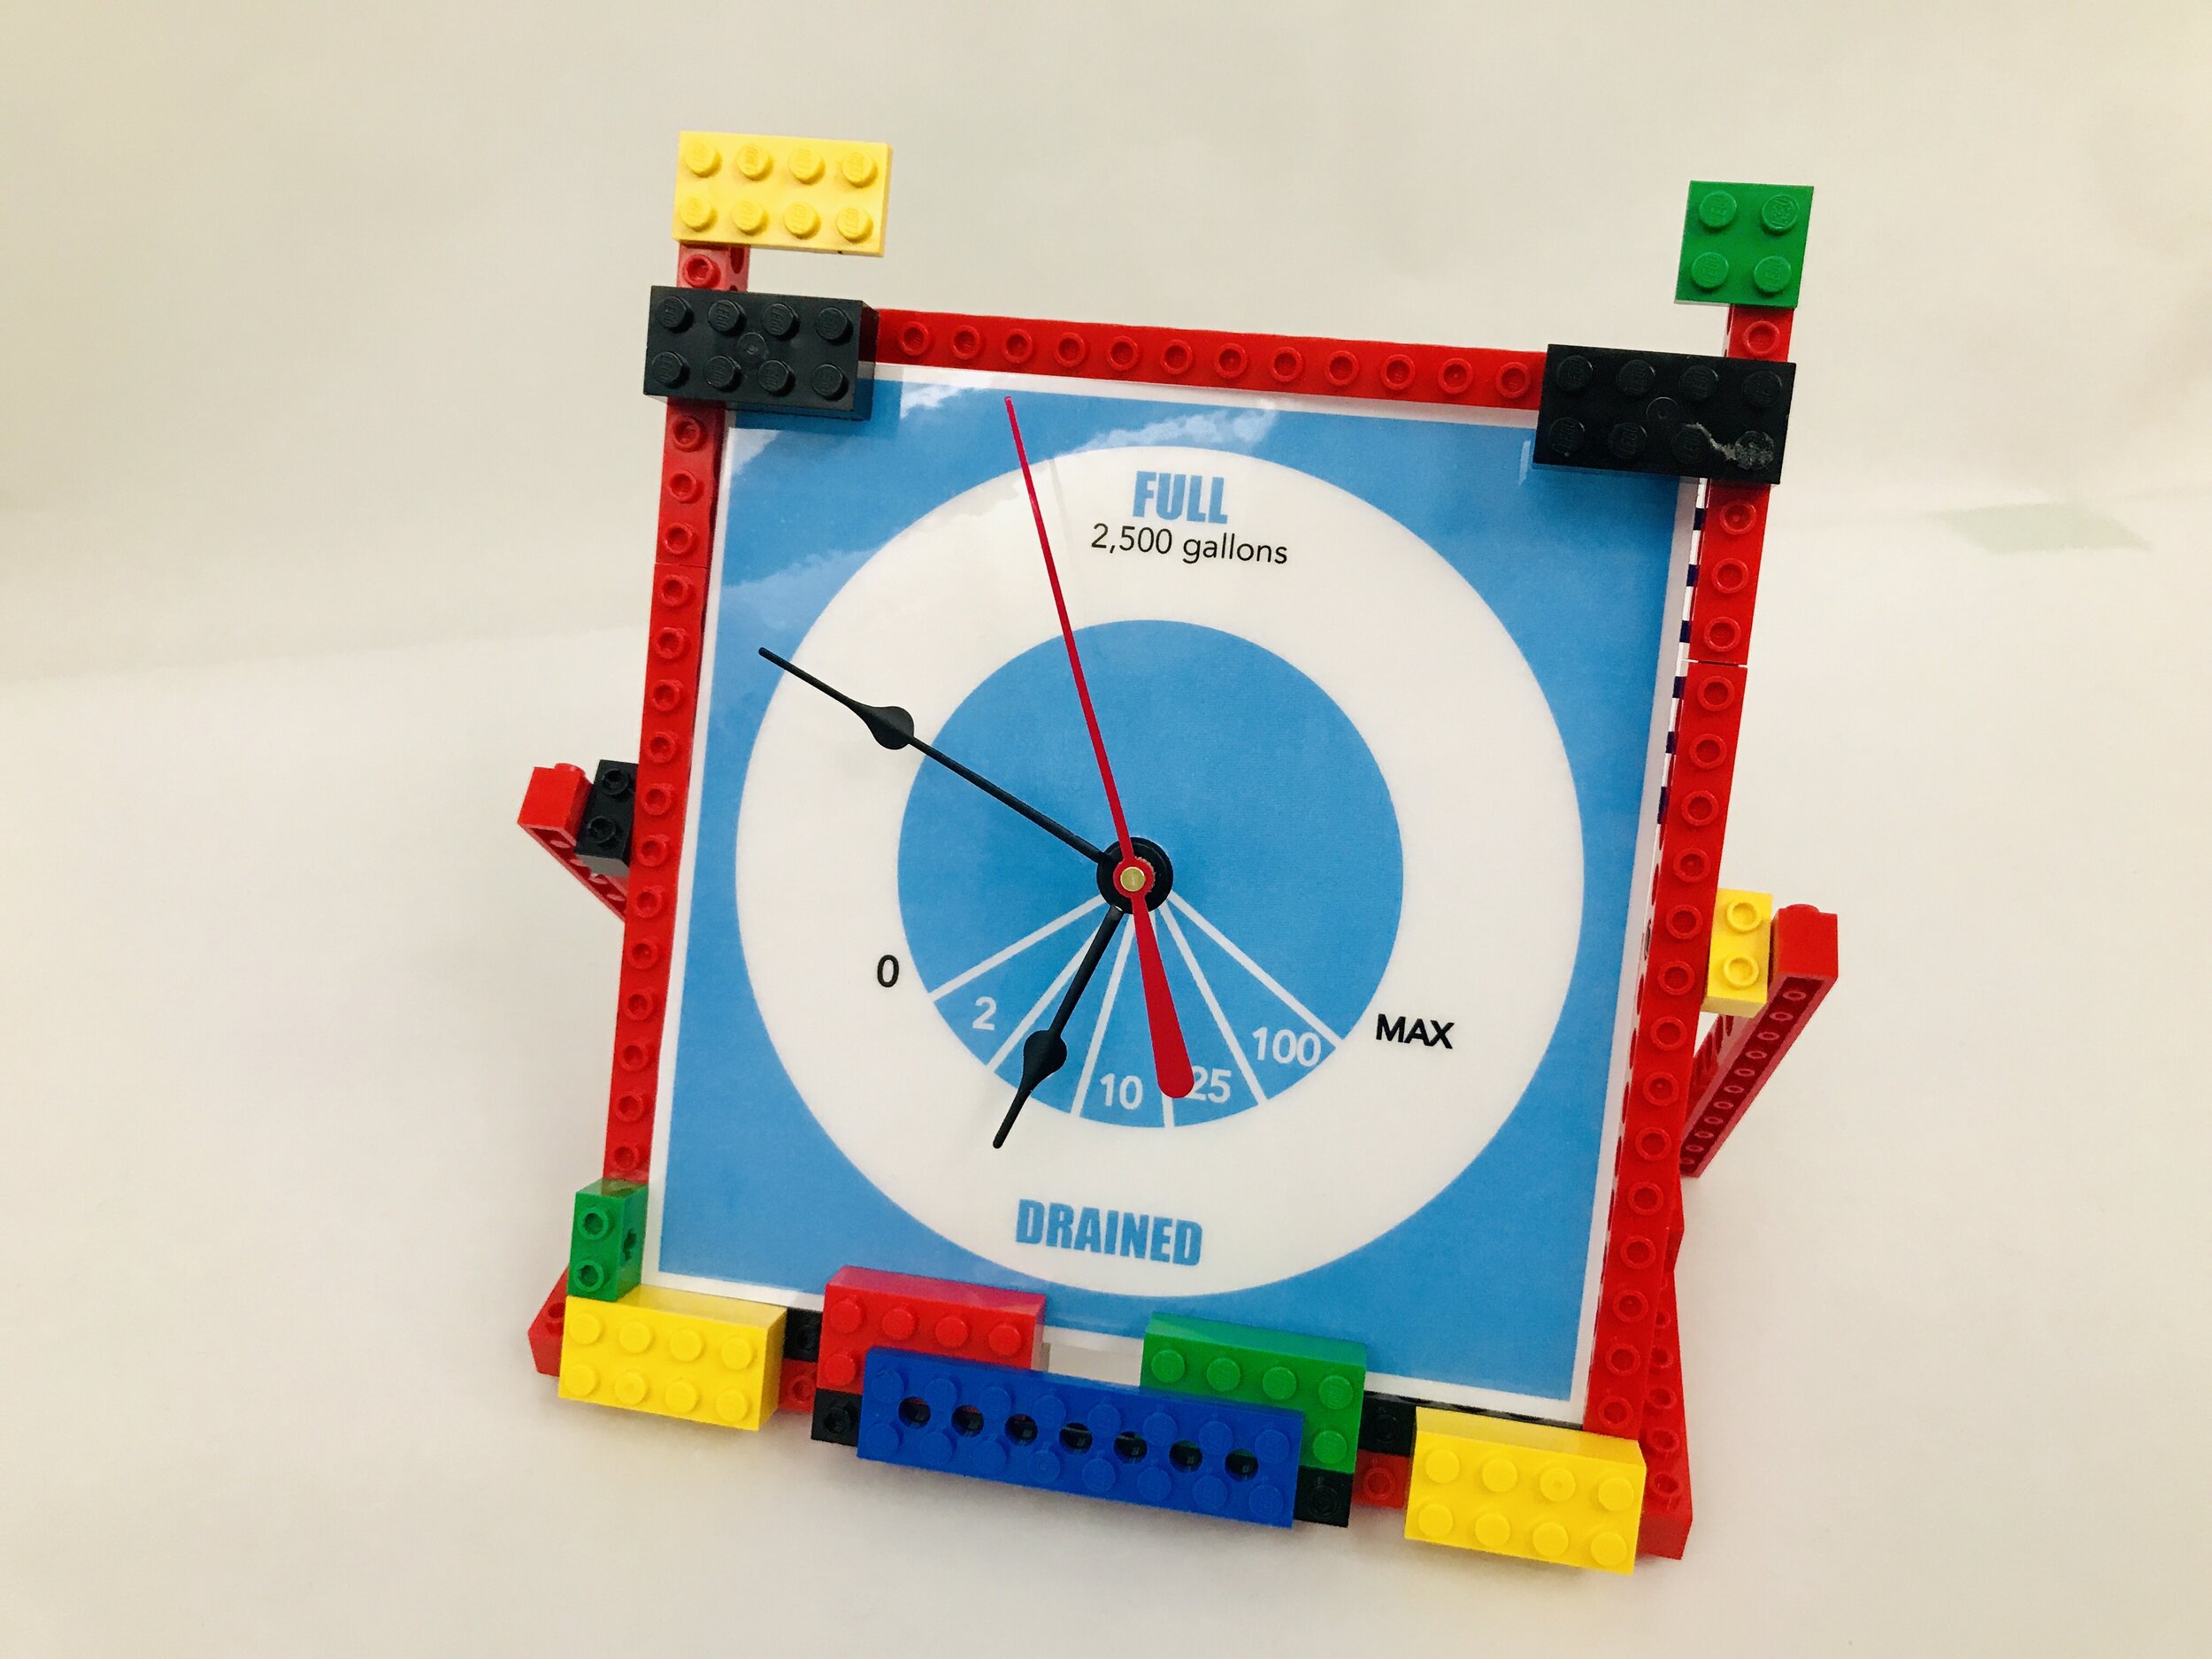
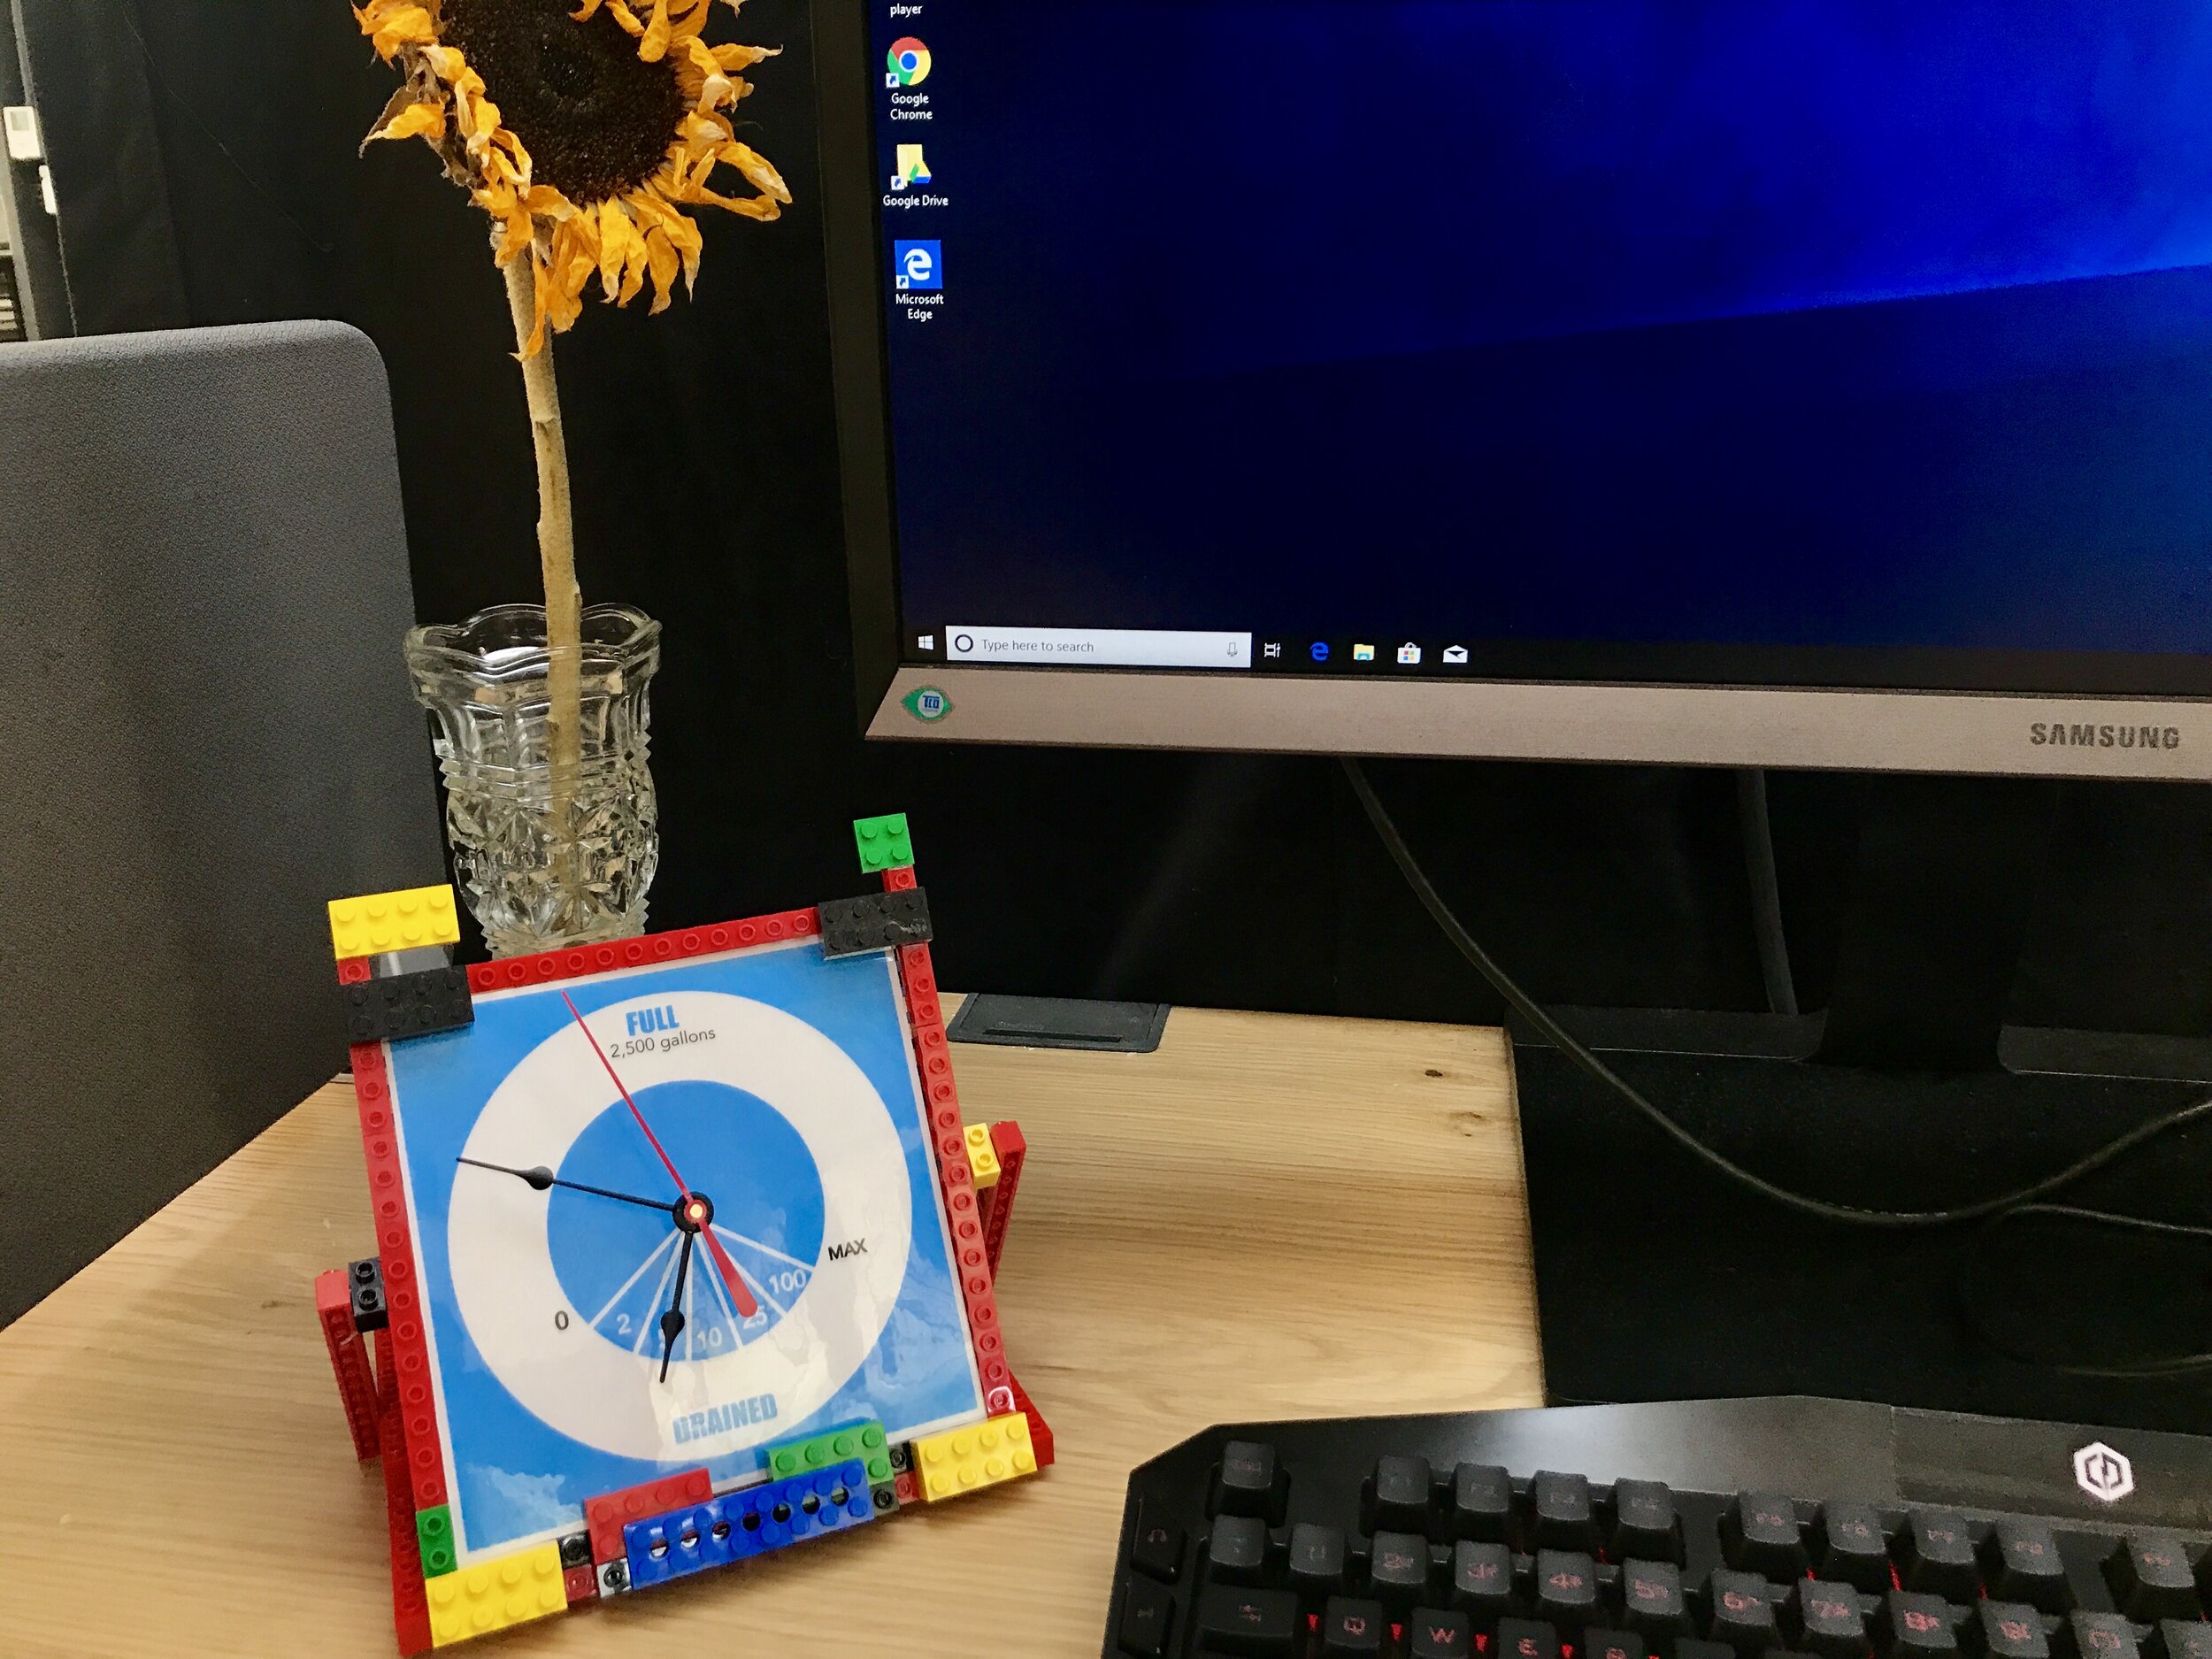
Current rate of flow of water into the garden. This is indicator on the clock by the red hand that goes from “O” to “MAX”, similar to a speedometer.
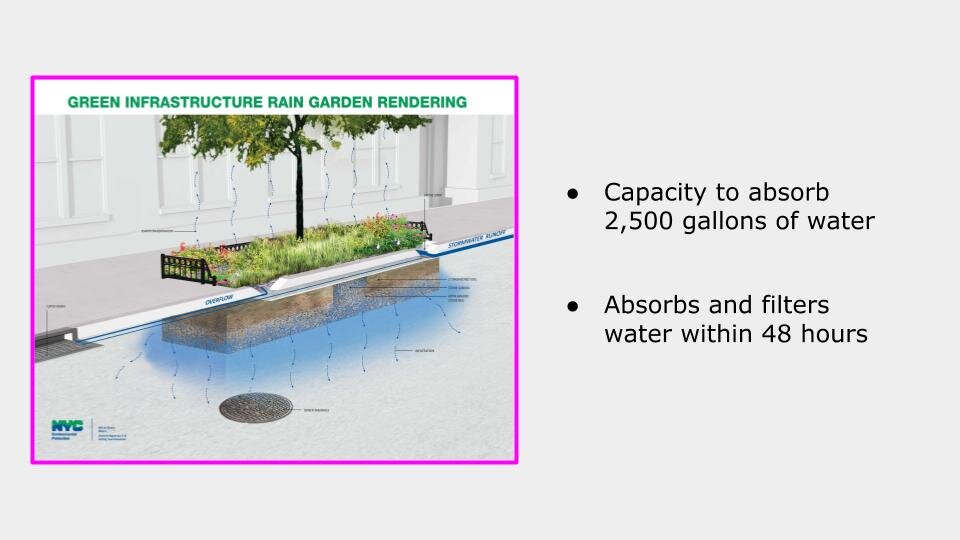
Water level (number of gallons) collected in the garden. This is indicated by the big hand on the clock. The max amount the rain garden can hold is 2,500 gallons. As it fills up, the big hand moves up towards the “Full” position on the clock. As the water drains (usually this happens over 48 hour period), it moves clockwise back down to the “Drained” position.
Type of storm (return period). This is indicated on the clock by the small hand that moves to the 2, 5, 10, 25 or 100 position in order to show the return period of the storm. I need to do more research into whether this is possible to predict real-time.
I am still intending this device to be used by a garden steward, possibly in conjunction with the other devices in order to monitor the garden. With this motivation I again used legos to build the body of the clock and printed out the face.
Future steps
If I were to extend the project, I’d like to complete the final step of connecting the data I’m collecting to the clock so that it actually runs. I’d also like to contact the city and get their permission to install some devices. I really liked the idea from Dr. Henaff to create a booklet similar to a tide chart or farmer’s almanac. I think this could be a way to connect both the calendar and clock time-scale views. I have also been considering the idea of displaying the clock on the garden itself rather than making it a remote piece.
You can see my presentation slides below:
