Urban interfaces


About
Rain Gardens (bioswales) are a form of green infrastructure built to improve street drainage, sewer system overflow and water quality in New York City waterways. What is striking about Rain Gardens is that they invisible infrastructure. Underneath their surface are imperceptible flows, a living spongy world made of dirt, rocks, gravel doing hidden work as part of a larger water ecosystem. One of the goals of the project is to unearth and bring to the surface what is underground. The presence of the rain garden fuzzes the the boundary between our lives and the NYC waterways. By acting as a permeable layer with multi-dimensional movement and flows, it destabilizes our conceptual model of the solid water system made of concrete, gutters and pipes.
Through a series of experiments around the rain garden, I ask: how could a device...
Expand the boundary around citizenship to include maintenance of systems?
Make inputs and outputs explicit in order to re-draw the boundary of the Rain Garden?
This project addresses these questions by using different methods to make the rain garden data part of the visible aspects of the infrastructure. My hope is that this project prompts the viewer or passerby to acknowledge that both they and the rain garden are actors in the same system.
Steward Device
Rain Gardens require extensive engineering to build and are actively maintained by the city and volunteer Garden Stewards. Anyone can apply to be a Garden Steward, and depending on the volunteer’s experience, the City provides training on how to perform simple maintenance a few times a month, carry out sediment removal and weeding, and organizing planting events.
In the context of the larger water system, I wanted to make the passerby connect the dots between the different actors and blur their previously conceived boundaries in order to reconfigure the Rain Garden data in a meaningful way. The rain garden data is normally separate from the physical garden, usually located in an open data portal or report produced by the city. This project aims to make it part of the Rain Garden form itself. This project asks: in what ways is the rain garden a manifestation of the data? In what ways is the data a manifestation of the rain garden?
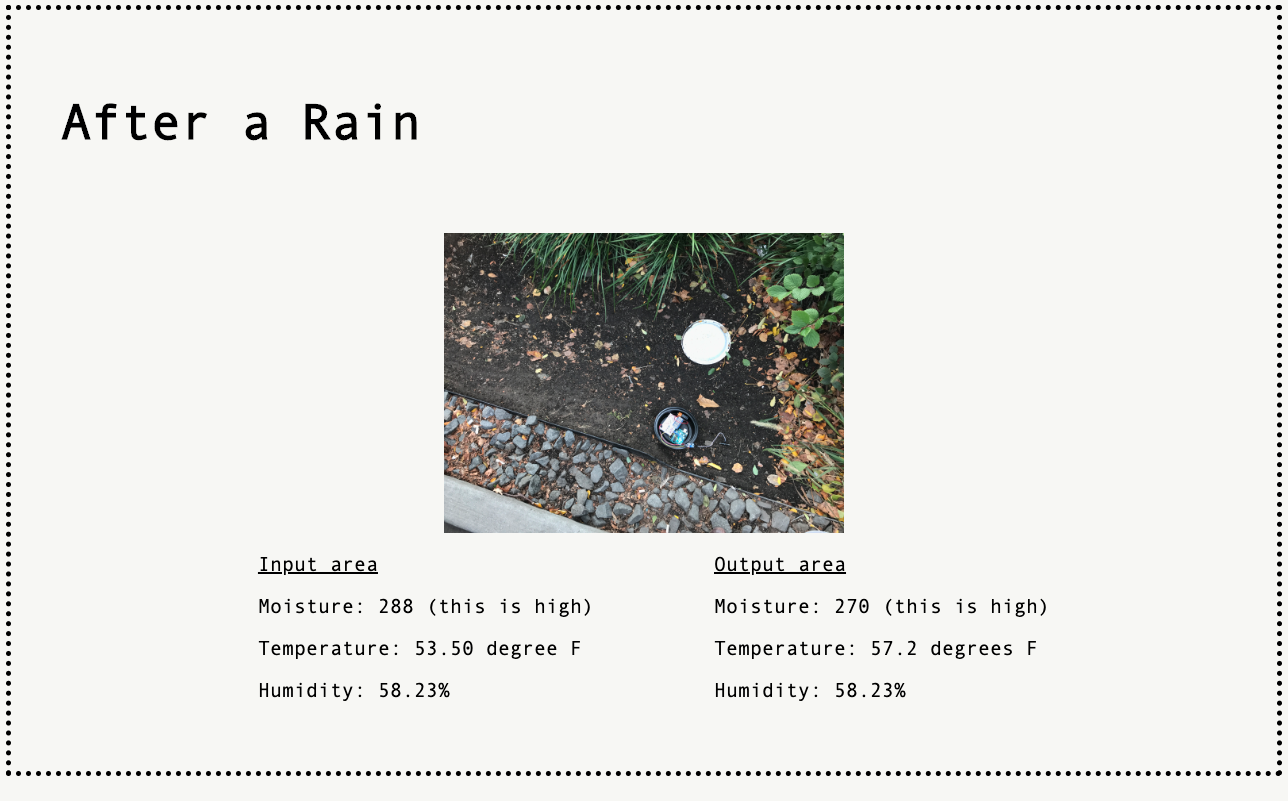
The device uses two sensors: 1) a moisture sensor and 2) a humidity and temperature sensor connected to an Arduino that takes the data and displays it on a mini LCD screen when the corresponding buttons are pressed.
The garden steward uses this device to display the data points on the rain garden signs that explain how the rain garden works:


2. filtration clock
The filtration clock is an IoT time device for the Rain Garden to measure its cycles and flows of water and a corresponding clock face to display these sequences. Water the most significant input and output to the rain garden but it is difficult to see or fully understand this cycle and visualize it.
The design and approach is also based on research on storm hydrographs and the return period for storms. The Northeast Regional Climate Center has found that these storms are getting stronger and more frequent in the New York City region. This device asks if these rhythms can be captured and if the methods and materials through which they are “visualized” changes how they are noticed and understood.
The filtration clock displays the following for each rain event:
Current rate of flow of water into the garden. This is indicator on the clock by the red hand that goes from “O” to “MAX”, similar to a speedometer.
Water level (number of gallons) collected in the garden. This is indicated by the big hand on the clock. The max amount the rain garden can hold is 2,500 gallons. As it fills up, the big hand moves up towards the “Full” position on the clock. As the water drains (usually this happens over 48 hour period), it moves clockwise back down to the “Drained” position.
Type of storm (return period). This is indicated on the clock by the small hand that moves to the 2, 5, 10, 25 or 100 position in order to show the return period of the storm.
The device is intended to be used by a garden steward, possibly in conjunction with the monitoring device.


3. Rain garden codes
Inspired by Urban Code: 100 Lessons for Understanding the City, Rain Garden Codes is a summary of observations I made while studying the rain gardens. Urban Code distills city dynamics into simple movements and relationships in order to better understand them and learn from them. My hope is that these rain garden codes could be a source of insight or point of departure for further research or infrastructure development as the city expands its green infrastructure.


4. Research Journal
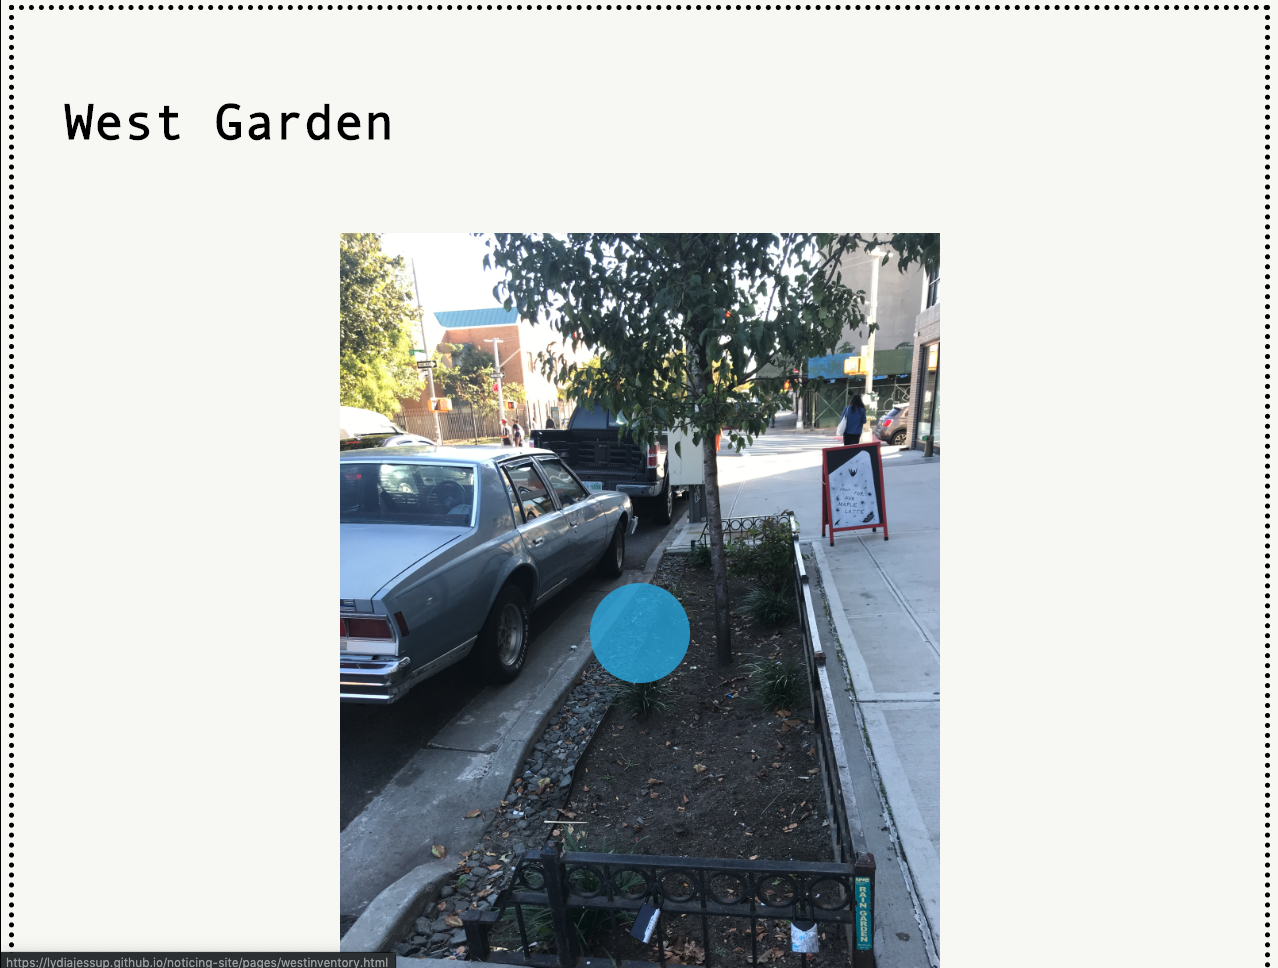
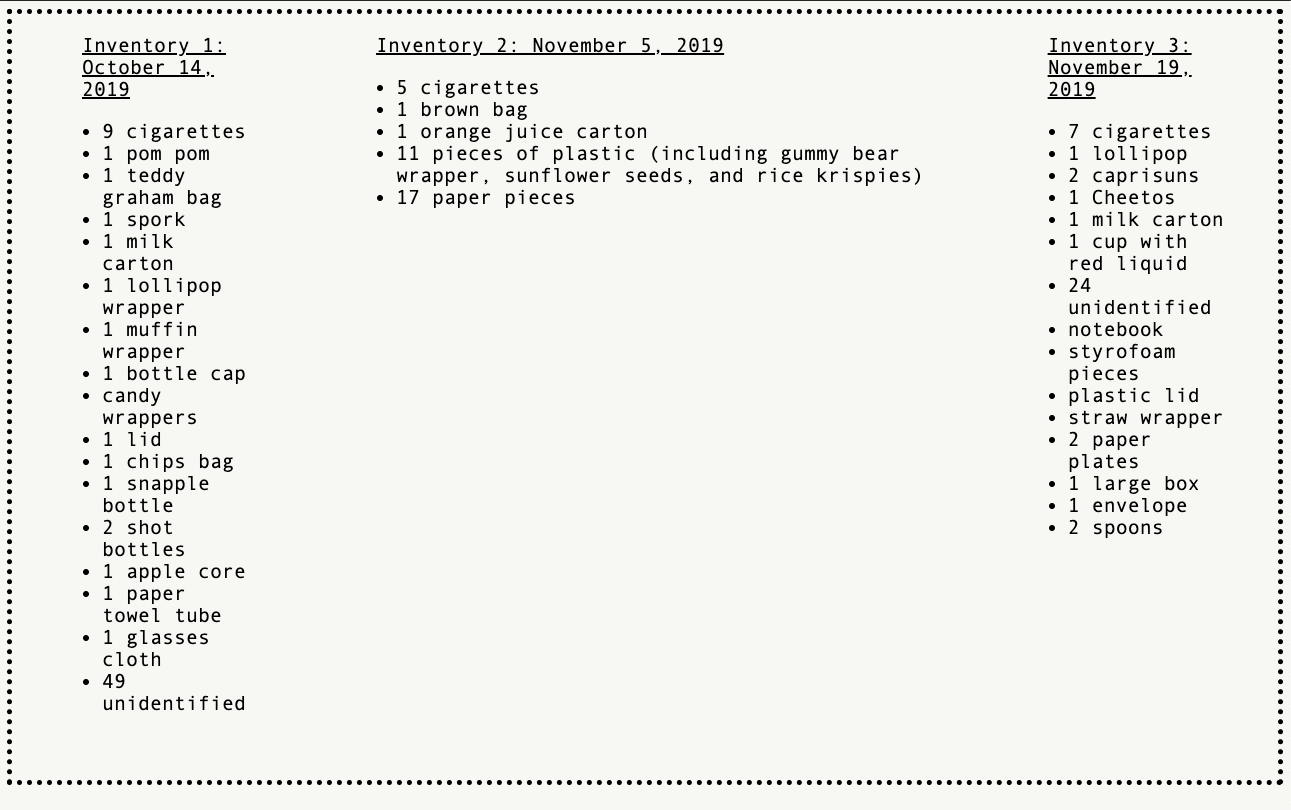
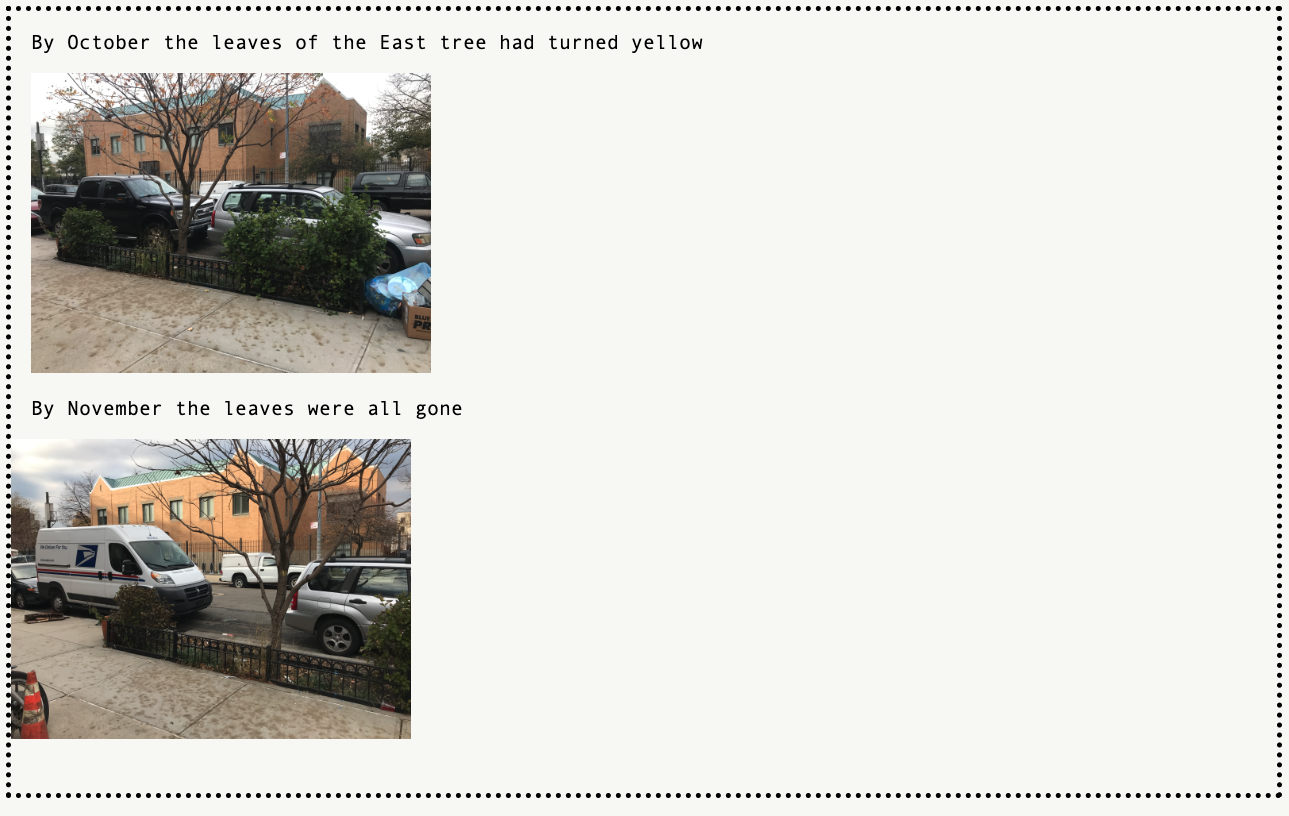
I conducted these experiments while doing a practice of weekly visits to a set of rain gardens in Bed-Stuy, Brooklyn, NYC at the intersection of Nostrand and Kosciusko. The website-based research journal documents these observations and acts of noticing. The website is designed so that the visitors feels as though are were exploring and getting to know the gardens themselves. Upon entering the garden page, the visitor hears sound I recorded at the gardens and can navigate the garden by clicking on different hyperlinked spots (indicated by blue circles). The visitor can also compare the gardens using this method of exploration as well. This design was heavily inspired by the hypertext project My Body by Shelley Jackson.
You can visit the site here: https://lydiajessup.github.io/noticing-site/
And the code is on Github here: https://github.com/lydiajessup/noticing-site